Complete Guide to Tableau for Data Scientists

Complete Guide to Tableau for Data Scientists
.MP4, AVC, 1280x720, 30 fps | English, AAC, 2 Ch | 10h 29m | 1.38 GB
Instructor: Matt Francis
.MP4, AVC, 1280x720, 30 fps | English, AAC, 2 Ch | 10h 29m | 1.38 GB
Instructor: Matt Francis
If your work requires any sort of graphical visualization of data, chances are you’ve run into Tableau. If you’ve been using Tableau but want to learn how to really harness its full power for data science, join expert Matt Francis in this course as he shows you how to take your skills to the next level.
Matt starts with one of the most important features in Tableau: the difference between the green and blue pills (discrete and continuous data) and how this affects every single action Tableau performs. He then shows how to connect to and combine data from different data sources, how to create different charts to make sense of data, ways to transform your data with calculations, and how to create interactive maps. Finally, Matt details ways to present data effectively and how to make engaging dashboards. Whether you want to learn more about Tableau as a whole, or if you just want to improve your knowledge of a single subject, this course will help up your Tableau game.
Learning objectives
- 1. Differentiate between continuous and discrete data, and understand how Tableau treats them differently when visualizing data.
- 2. Connect to various data sources, including Excel files, Google Sheets, PDFs, databases, and web data connectors, and bring the data into Tableau.
- 3. Join multiple data tables using different join methods (inner, left, right, outer), unions, and cross-database joins to combine data from multiple sources.
- 4. Create and optimize Tableau Data Extracts (TDE) for faster performance, and manage data extracts by limiting, refreshing, and editing them as needed.
- 5. Construct advanced visualizations, such as combined axis charts, dual axis charts, bar-in-bar charts, crosstabs, scatter plots with trend lines and animations, and box plots.
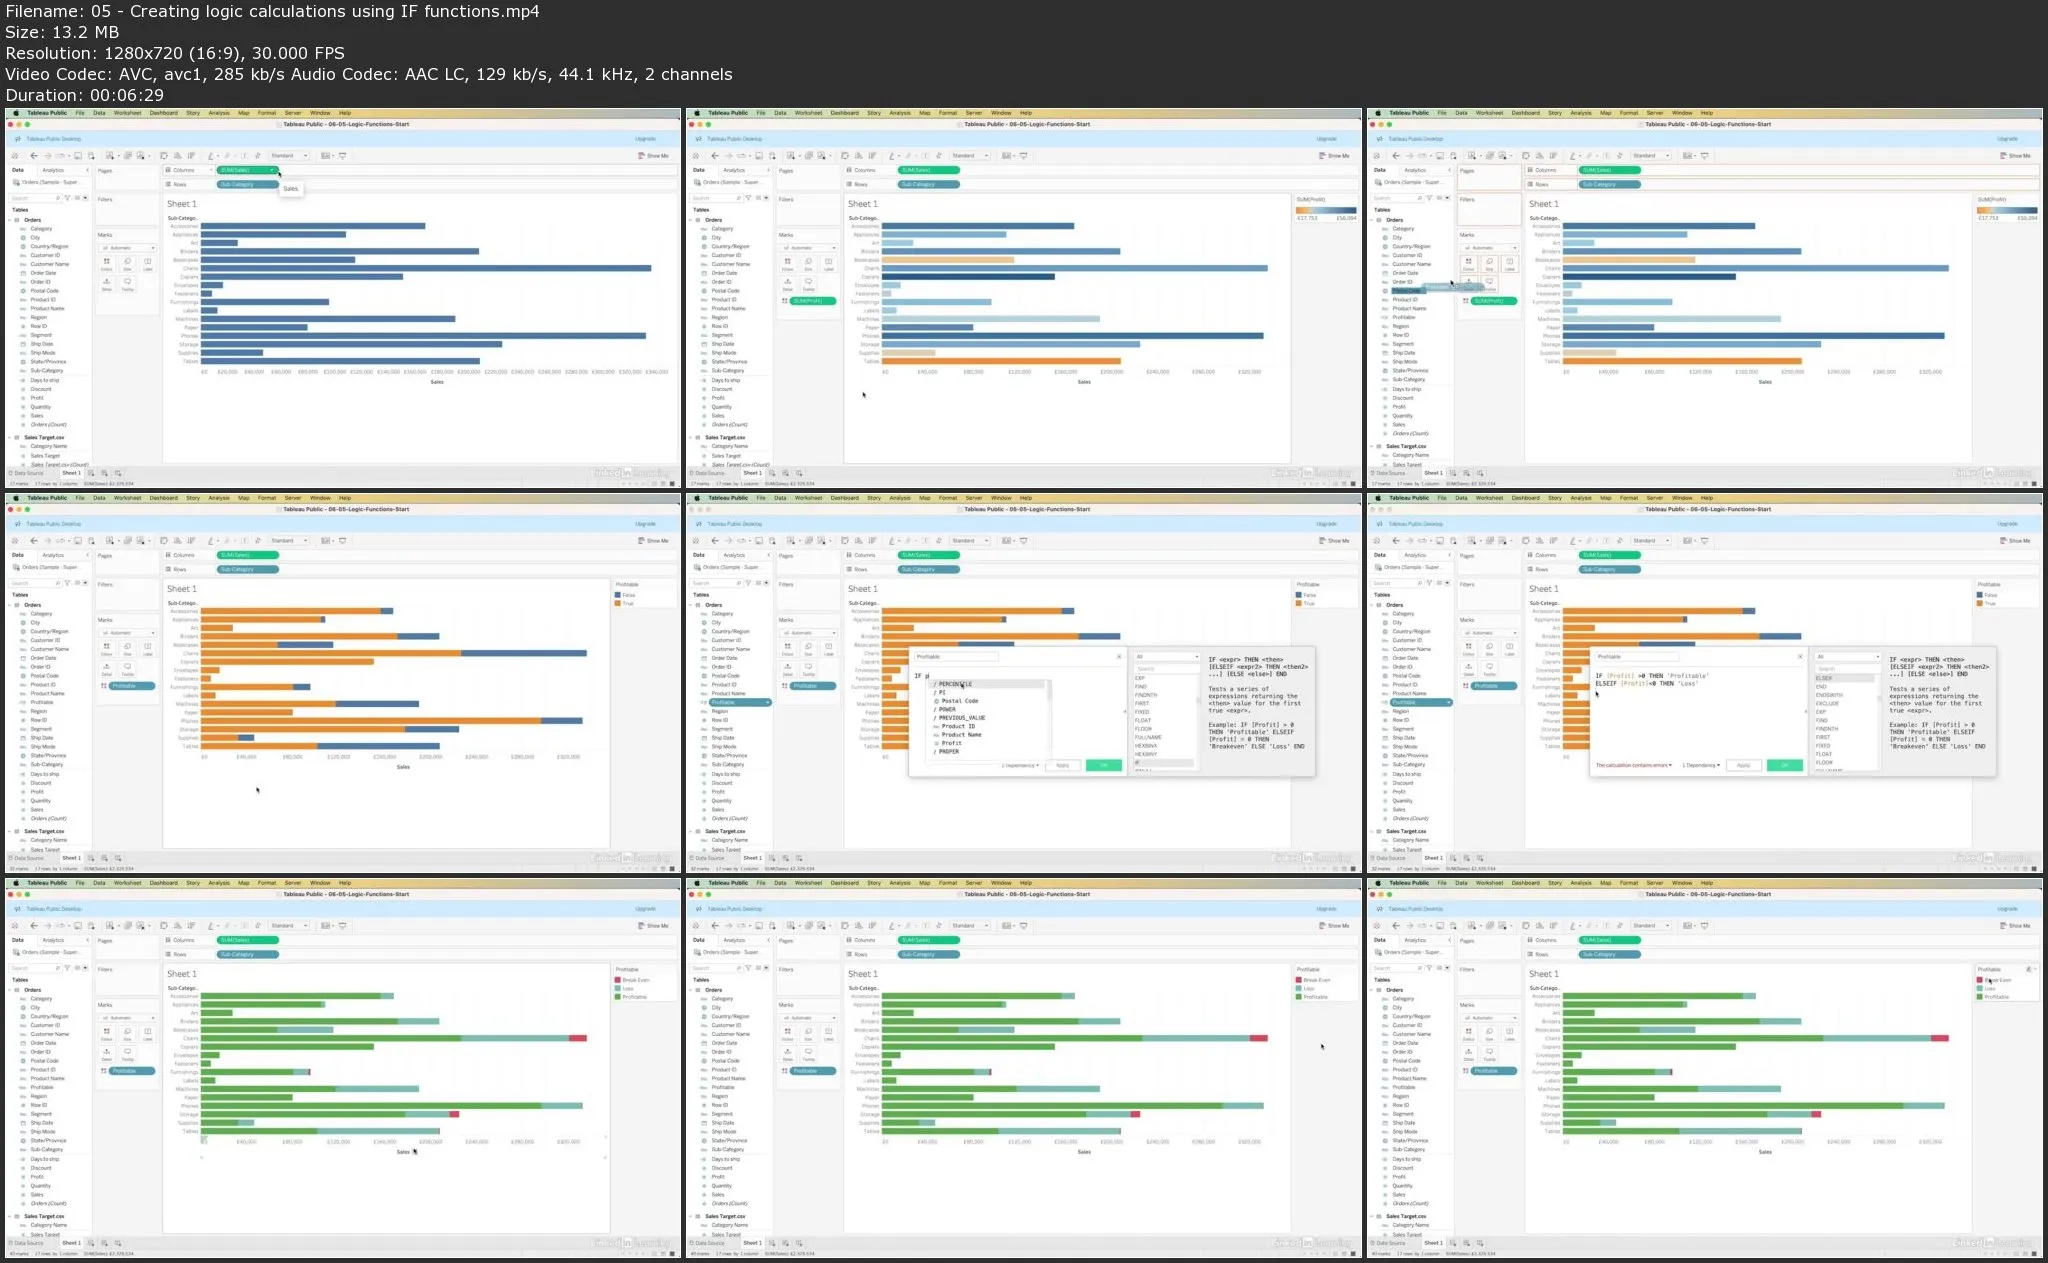
- 6. Build complex calculations using Tableau's calculation editor, including table calculations, level of detail (LOD) calculations, date calculations, and logical calculations with the IF function.
- 7. Design interactive dashboards using layout containers, tiled and floating layouts, device-specific dashboards, and actions (filter, highlight, URL, set, and parameter actions) to enhance user engagement.
Complete Guide to Tableau for Data Scientists