Excel for Data Analysis: Basic to Expert Level

Excel for Data Analysis: Basic to Expert Level
MP4 | Video: AVC 1280x720 | Audio: AAC 44KHz 2ch | Duration: 2 Hours | Lec: | 1.87 GB
Genre: eLearning | Language: English
MP4 | Video: AVC 1280x720 | Audio: AAC 44KHz 2ch | Duration: 2 Hours | Lec: | 1.87 GB
Genre: eLearning | Language: English
Learn how to use Excel for data analysis to an expert level and be able to apply this practical skill in any field.
Learn Excel for data analysis from basic to expert level and be able to apply this practical skill in any field. It explores spreadsheet software’s most relevant features which will help you become an expert as beginner, achieve proficiency as basic user or polish skills and finish learning curve as an intermediate one. All of this while using real-world data together with practical exercises done step-by-step.
Become an Expert in Excel for data analysis by learning its most relevant features.
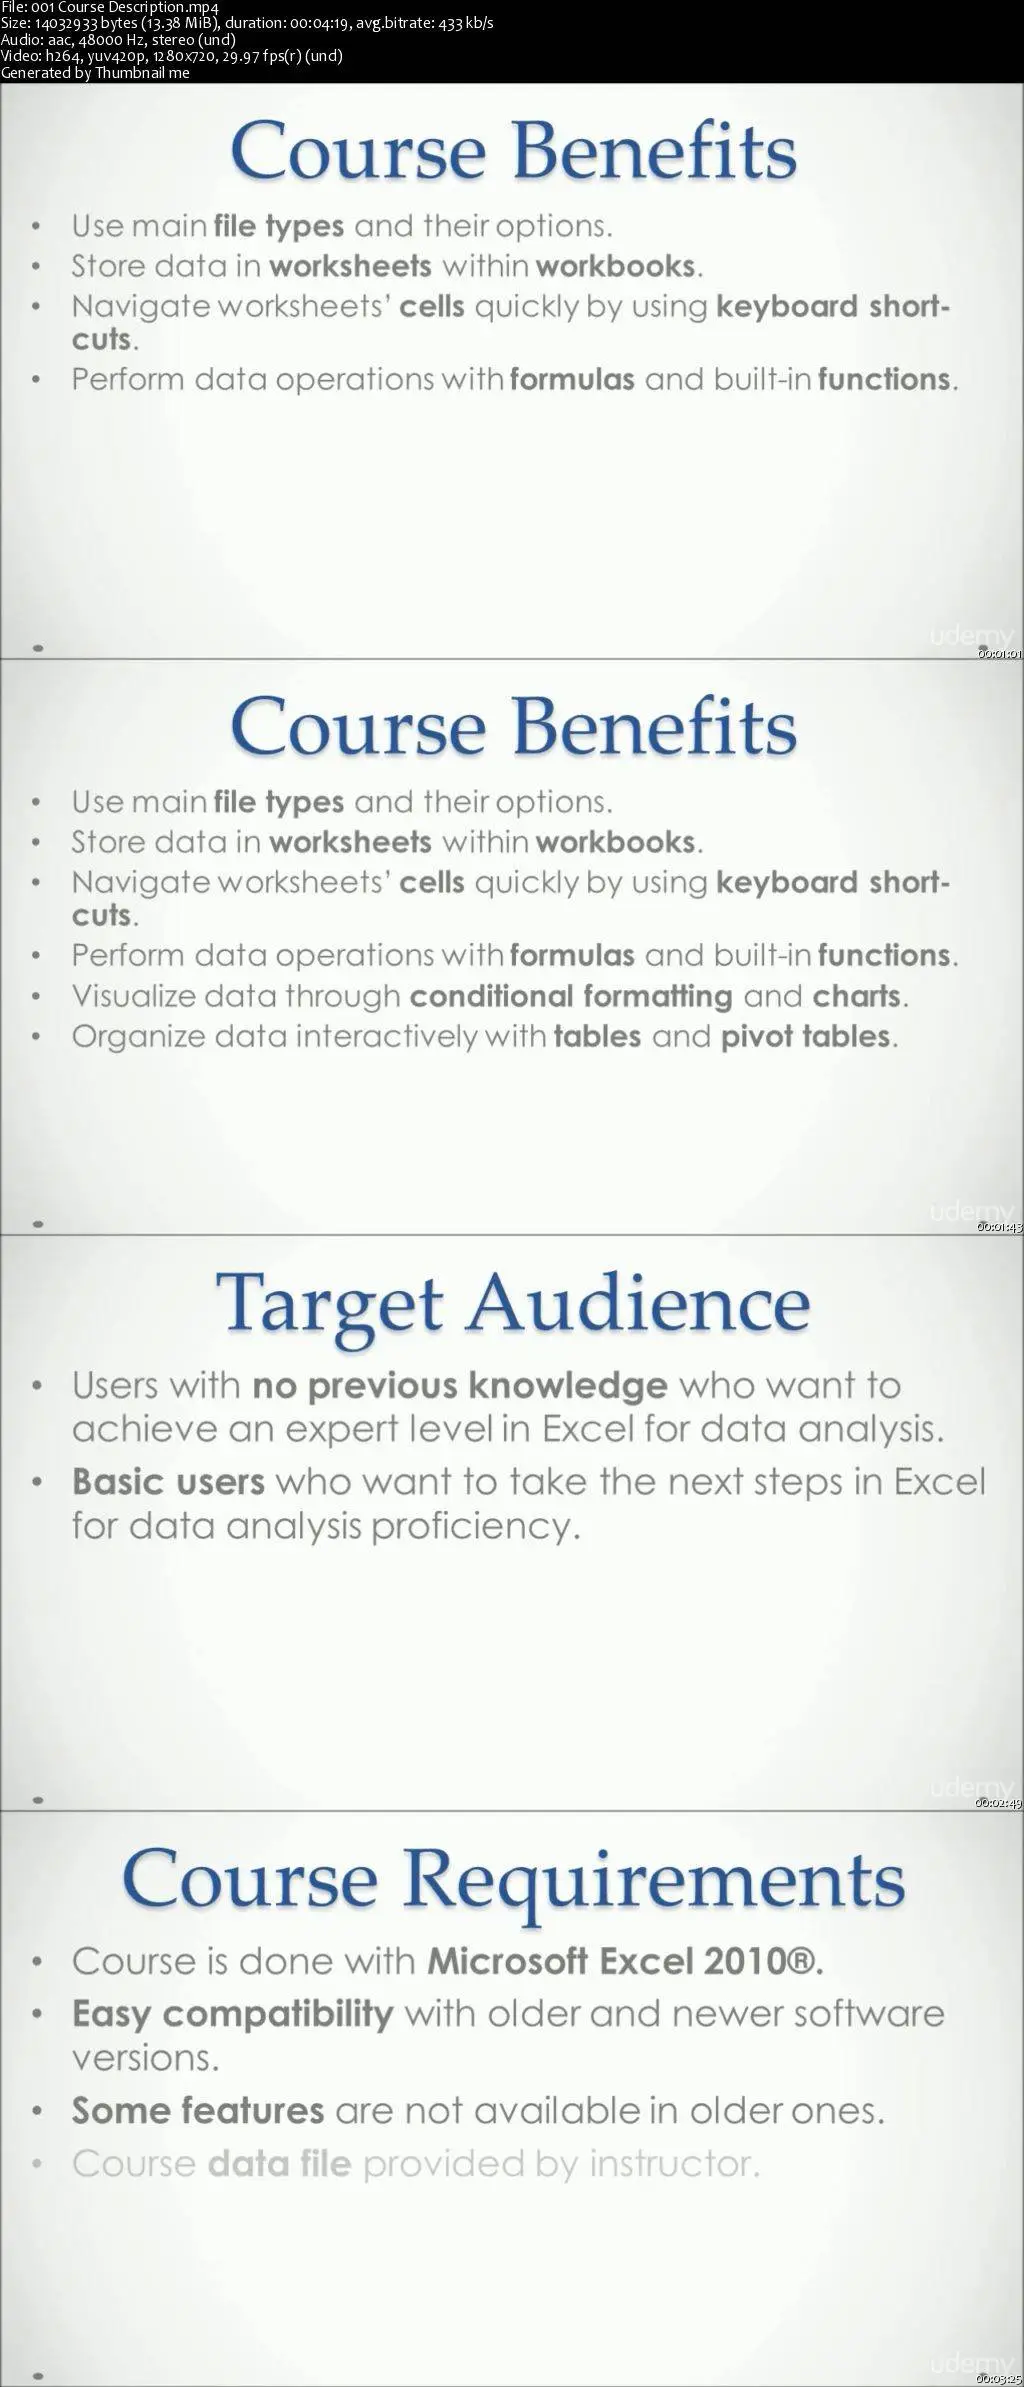
Use main file types and their options.
Store data in worksheets within workbooks.
Navigate worksheets’ cells quickly by using keyboard short-cuts.
Perform data operations with formulas and built-in functions.
Visualize data through conditional formatting and charts.
Organize data interactively with tables and pivot tables.
Implement scenarios with what-if analysis.
Analyze data with statistical and probabilistic add-in tools.
Optimize formula results with solver add-in.
Achieve Excel for data analysis proficiency and be able to apply it in any field.
Learning Excel is essential for any professional or academic career based on data analysis. It is the most commonly used data analysis software both professionally and academically and it’s a solid foundation before learning any other.
But as learning process can become difficult as complexity grows, this course helps by leading you through step-by-step real-world practical exercises for greater effectiveness.
Content and Overview
This course contains 39 lectures and 6.5 hours of content. It’s designed for all Excel knowledge levels and no previous familiarity is required.
At first, you’ll learn how to use main file types depending on data format and how to protect it when sharing. Then you’ll study how to store data in workbooks containing one or more worksheets and their navigation by identifying cells as intersection points of columns and rows. This can be done quicker when using keyboard short-cuts.
After that, you’ll perform data calculations with formulas and built-in functions, correct any errors in them, and perform input validation when interacting with users. Next, you’ll visualize data with conditional formatting and charts. You’ll organize it interactively with tables and pivot tables which can be sorted and filtered.
Later, you’ll implement scenarios with what-if analysis. You’ll also do data analysis through statistical and probabilistic add-in tools such as identifying trends, deliver descriptive statistics and frequency histograms, evaluate correlation and causation between explained and explanatory variables, and simulate random numbers with pre-defined or user-defined probability distribution functions. Finally, you’ll optimize a formula’s result using solver add-in by defining changing variables and their constraints.

Excel for Data Analysis: Basic to Expert Level