

GraphPad Prism v5.04 Retail
GraphPad Prism v5.04 Retail | 23.1 Mb
GraphPad Prism is a powerful combination of basic biostatistics, curve fitting and scientific graphing in one comprehensive program. More than 100,000 scientists in over 100 countries rely on Prism to analyze, graph and present their scientific data.
What makes Prism the program of choice for many of the world's leading universities, medical centers, research institutes and pharmaceutical companies? Prism certainly has all the capabilities you would expect from a top notch scientific graphics program, but what makes Prism truly unique is not what it does, but how it does it. Designed for the practical scientist, Prism does not expect you to be a statistician. It guides you through each analysis - giving you as much help as you need - and tracks and organizes your work like no other program available. You can concentrate on your data, not fight with your software.
Curve fitting
Nonlinear regression is an important tool in analyzing data, but is often more difficult than it needs to be. No other program simplifies curve fitting like Prism. In fact, you can usually fit curves in a single step. Just select an equation from the extensive list of commonly used equations (or enter your own equation) and Prism does the rest automatically – fits the curve, displays the results as a table, and draws the curve on the graph. Even better, Prism will automatically fit all related data sets at once. You don't have to repeat commands for each experimental condition.
Don't be fooled by the simplicity. Prism also gives you many advanced fitting options - automatically interpolate unknown values from a standard curve (i.e., to analyze RIA data), compare two equations with an F test or Akaike's Information Criterion (AIC), and plot residuals. Prism also lets you fit curves to a family of data sets at once, sharing the best-fit value of selected parameters to find one best-fit value that applies to the entire family, rather than individual best-fit values for each data set. Read more about global curve fitting - an incredibly versatile, but underused analysis technique.
The best way to learn nonlinear regression is to follow examples. The Prism 5 help system is a wonderful resource for learning about curve fitting. Our Guided Examples teach you how to think about nonlinear regression, as well as how to use Prism. All the examples use sample data built-in to the program, so you can easily work through the examples without any tedious data entry. Examples include fitting an enzyme kinetics curve, interpolating from a sigmoidal standard curve, global nonlinear regression and more.
Statistics
Prism offers a more comprehensive set of tools to analyze your data than any other scientific graphics package. While it won't replace a heavy-duty statistics program, Prism lets you easily perform basic statistical tests commonly used by laboratory and clinical researchers. Prism offers t tests, nonparametric comparisons, one- and two-way ANOVA, linear and nonlinear regression, analysis of contingency tables, and survival analysis. See a complete lists of available tests.
Unlike other programs, Prism provides statistical help when you need it. Press "Learn" from any data analysis dialog and Prism's online documentation will explain the principles of the analysis to help you make appropriate choices. Once you've made your choices, Prism presents the results on organized, easy-to-follow tables. If you need help understanding the statistical terminology in the results table, Prism's unique analysis checklists take you to analysis explanations and help you check to make sure you chose an analysis appropriate for your experimental design.
The Prism documentation goes beyond anything you would expect. More than half of it is devoted to thorough explanations of basic statistics and nonlinear curve fitting, to teach you what you need to know to appropriately analyze your data.
The Prism 5 help system is a wonderful resource for learning about statistics. Our Guided Examples teach you how to think about statistics, as well as how to use Prism. All the examples use sample data built-in to the program, so you can easily work through the examples without any tedious data entry. There are more than a dozen examples ranging from a simple unpaired t test to repeated measures two-way ANOVA, survival analysis, contingency tables and more.
Available tests:
Statistical comparisons
- Paired or unpaired t tests
- Mann-Whitney or Wilcoxon tests
- Ordinary or repeated measures one-way ANOVA with Tukey, Newman-Keuls, Dunnett or Bonferroni post tests, or the post-test for trend
- Kruskal-Wallis or Friedman nonparametric one-way ANOVA with Dunn's post test
- Fisher's exact test or the chi-square test. Calculate the relative risk and odds ratio with confidence intervals
- Two-way ANOVA, even with missing values with some post tests
- Repeated measures two-way ANOVA with some post tests
- Kaplan-Meier survival analysis. Compare curves with the log-rank test (including test for trend)
- Calculate min, max, quartiles, mean, SD, SEM, CI, CV, Geometric mean with Confidence Intervals
- Specify desired level of confidence
- Frequency distributions (bin to histogram), including cumulative histograms.
- Kolgoromov-Smirnov normality test
- One sample t test or Wilcoxon test to compare the column mean (or median) with a theoretical value
- Skewness and Kurtosis
- Calculate slope and intercept with confidence intervals
- Force the regression line through a specified point
- Fit to replicate Y values or mean Y
- Test for departure from linearity with a runs test
- Calculate and graph residuals
- Compare slopes and intercepts of two or more regression lines
- Determine new points along the standard curve
- Pearson or Spearman (nonparametric) correlation
- Table of XY coordinates
- Bland-Altman plots
- Receiver operator characteristic (ROC) curves
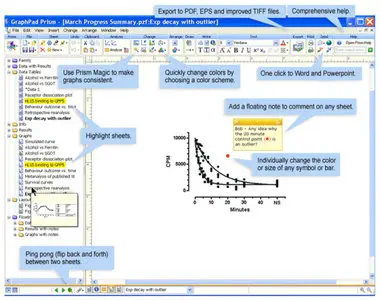
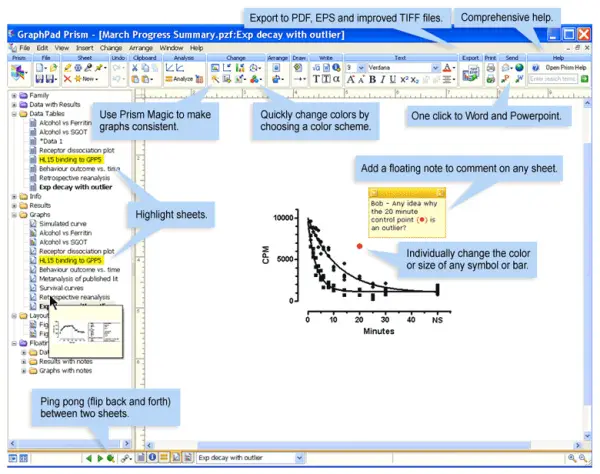
Quickly create publication-quality graphs of your data and easily customize every detail. Prism makes a wide variety of 2D scientific graphs, giving you all the features you need - including automatic error bars, log axes, discontinuous axes, Greek letters and much more - to create the look you want. Use Prism's toolbar buttons to instantly send your completed graphs to Word or PowerPoint, or export graphs in a wide variety of formats including high-resolution tif and EPS (Prism 5 only), suitable for publication in any journal.
Once you've created several graphs, arrange them on a page in Prism's unique page layout section. Start with a built-in page layout template, or create your own arrangement using special tools for aligning axes, creating insets and resizing graphs. You can even include analysis results on the same page to summarize your entire experiment for presentations and publications. Prism layouts can be printed at up to 30" x 40", so you can organize and print your poster right from Prism.
Organizing experiments
Prism brings you a completely new approach in scientific graphing software. Designed by a scientist for scientists, Prism works the way you do. Prism understands the links between data and analyses, and stores your related data, analysis results, graphs, layouts and notes in one efficient project file. Even your most complicated projects stay organized and easy to manage. Unlike other scientific graphics programs, Prism stores all your analysis results along with your data and graphs. And more importantly, Prism remembers exactly how you analyzed your data, even if it required several steps. When you open a Prism file, you can retrace every step of every analysis. Read on to learn more about how Prism can save you valuable time and effort.
Automatic error bars.
Protocols often require replicate measurements (i.e., triplicates). Most programs make it too difficult to calculate and plot error bars. Not Prism. Simply enter replicate values and Prism calculates and graphs error bars automatically. Choose from SD, SEM, 95% CI or range. With Prism there's no wading through a maze of unnecessary dialogs to make error bars.
Simultaneous analysis of related data sets.
Experiments typically compare several experimental conditions. With other programs, you must go through many tedious steps to analyze each data set - one at a time. Click one button and Prism analyzes and graphs several experimental conditions at once.
Efficient analysis of repeated experiments.
You rarely perform an experiment just once - you repeat it to verify results. With Prism you can analyze a repeated experiment in one step. Just plug in the new data, and Prism handles all the graphing and analysis steps automatically. Every file you save can be a template for a repeated experiment. This powerful feature can save you hours of repetitive work. And, if you need to analyze a large series of experiments, Prism's easy-to-use scripting language will automate importing the data files and exporting the results. It just doesn't get any easier.
Effortless corrections.
Even the most careful scientist can make a data entry mistake. With other programs, a simple mistake can cost you hours of wasted time. Not with Prism. That's because Prism data tables are linked to analyses, graphs and page layouts. When you fix a data entry mistake, your data are automatically reanalyzed and your graphs updated.
An organized record of work.
Science requires rigorous record keeping. Your data files should help you document your work.
Prism lets you enter unstructured notes and structured data (notebook number, experimenter, lot number, concentration, etc.) onto Info sheets. It's an ideal way to keep each part of your experiment organized and on target. Each info sheet can be linked to a particular data table or be general for the entire project. You can use info constants as constants in transforms, as constraints in nonlinear regression, and as graph titles and legends.
Download
No mirrors please
Welcome to my blog!