

GraphNow Function Grapher ver.3.1.7

This graphing calculator offers a professional solution for anyone who graphs functions. It helps to create 2D, 2.5D function graphs(Cartesian and polar), 3D curves, surfaces (Cartesian, cylindrical and spherical), animations and table graphs. High quality graphs can be created by setting the properties of curve, surface, axes and light.
Features
Creating 2D coordinate graphs, animations and table graphs
Functions can be in the form of explicit, parametric, piecewise, implicit and inequality
Cartesian and polar coordinate systems
coordinate graph animation
Graph of inverse function
Graph of derivative function
Parity of function
Maximum, minimum and inflexion
Integration
Root
The length of curve
Tangent and normal
Curvature circle
Point of intersection
Area of intersectant field
Use table data to create 2D line graphs
Scatter plot
Curve smoothing
Step plot
Stem plot
Graph of ordinary differential equation
Graph of limit
Graph of series
Tens of functions are provided
High quality graph effect, the curve created is very smooth
Creating 2.5D coordinate graphs, animations and table graphs
Functions can be in the form of explicit and parametric
Cartesian and polar coordinate systems
coordinate graph animation
Use table data to create 2.5D graph
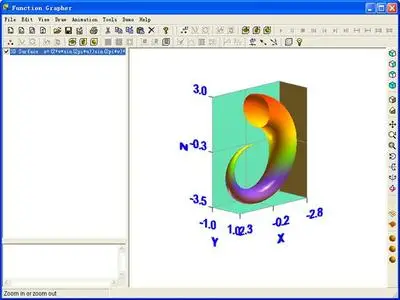
Creating 3D coordinate graphs, animations and table graphs
Functions can be in the form of explicit and parametric
Cartesian, cylindrical and spherical coordinate systems
3D curve and 3D surface
3D curve and 3D surface animation
Use table data to create 3D surface
Surface by rotation
Graph of partial derivative function
Tangent line and normal plane of 3D curve
Tangent plane and normal line of 3D surface
3D vector and it's subvector and projection
3D vector operation
Texture
Transparency
Material and light
Vertex, mesh and surface models
High quality graph effect
Creating color map, contour plot and vector plot
You can create a single plot or add color map, contour plot, vector plot and surface
to one graph
Ability to set and modify the properties of coordinate graphs, animations and table
graphs
Ability to move, zoom in, zoom out and rotate the graphs in plot area
Ability to save graphs as pgp file or bmp file
Ability to save animation as AVI file
Free Tools.