Forecasting Models with Excel

Forecasting Models with Excel
MP4 | Video: 1280x720 | 56 kbps | 48 KHz | Duration: 9 Hours | 2 GB
Genre: eLearning | Language: English
MP4 | Video: 1280x720 | 56 kbps | 48 KHz | Duration: 9 Hours | 2 GB
Genre: eLearning | Language: English
Learn main forecasting models and methods from basic to expert level through a practical course with Excel.
Learn forecasting models through a practical course with Excel using real world data. It explores main concepts from basic to expert level which can help you achieve better grades, develop your academic career, apply your knowledge at work or make business forecasting related decisions. All of this while exploring the wisdom of best academics and practitioners in the field.
Become a Forecasting Models Expert in this Practical Course with Excel
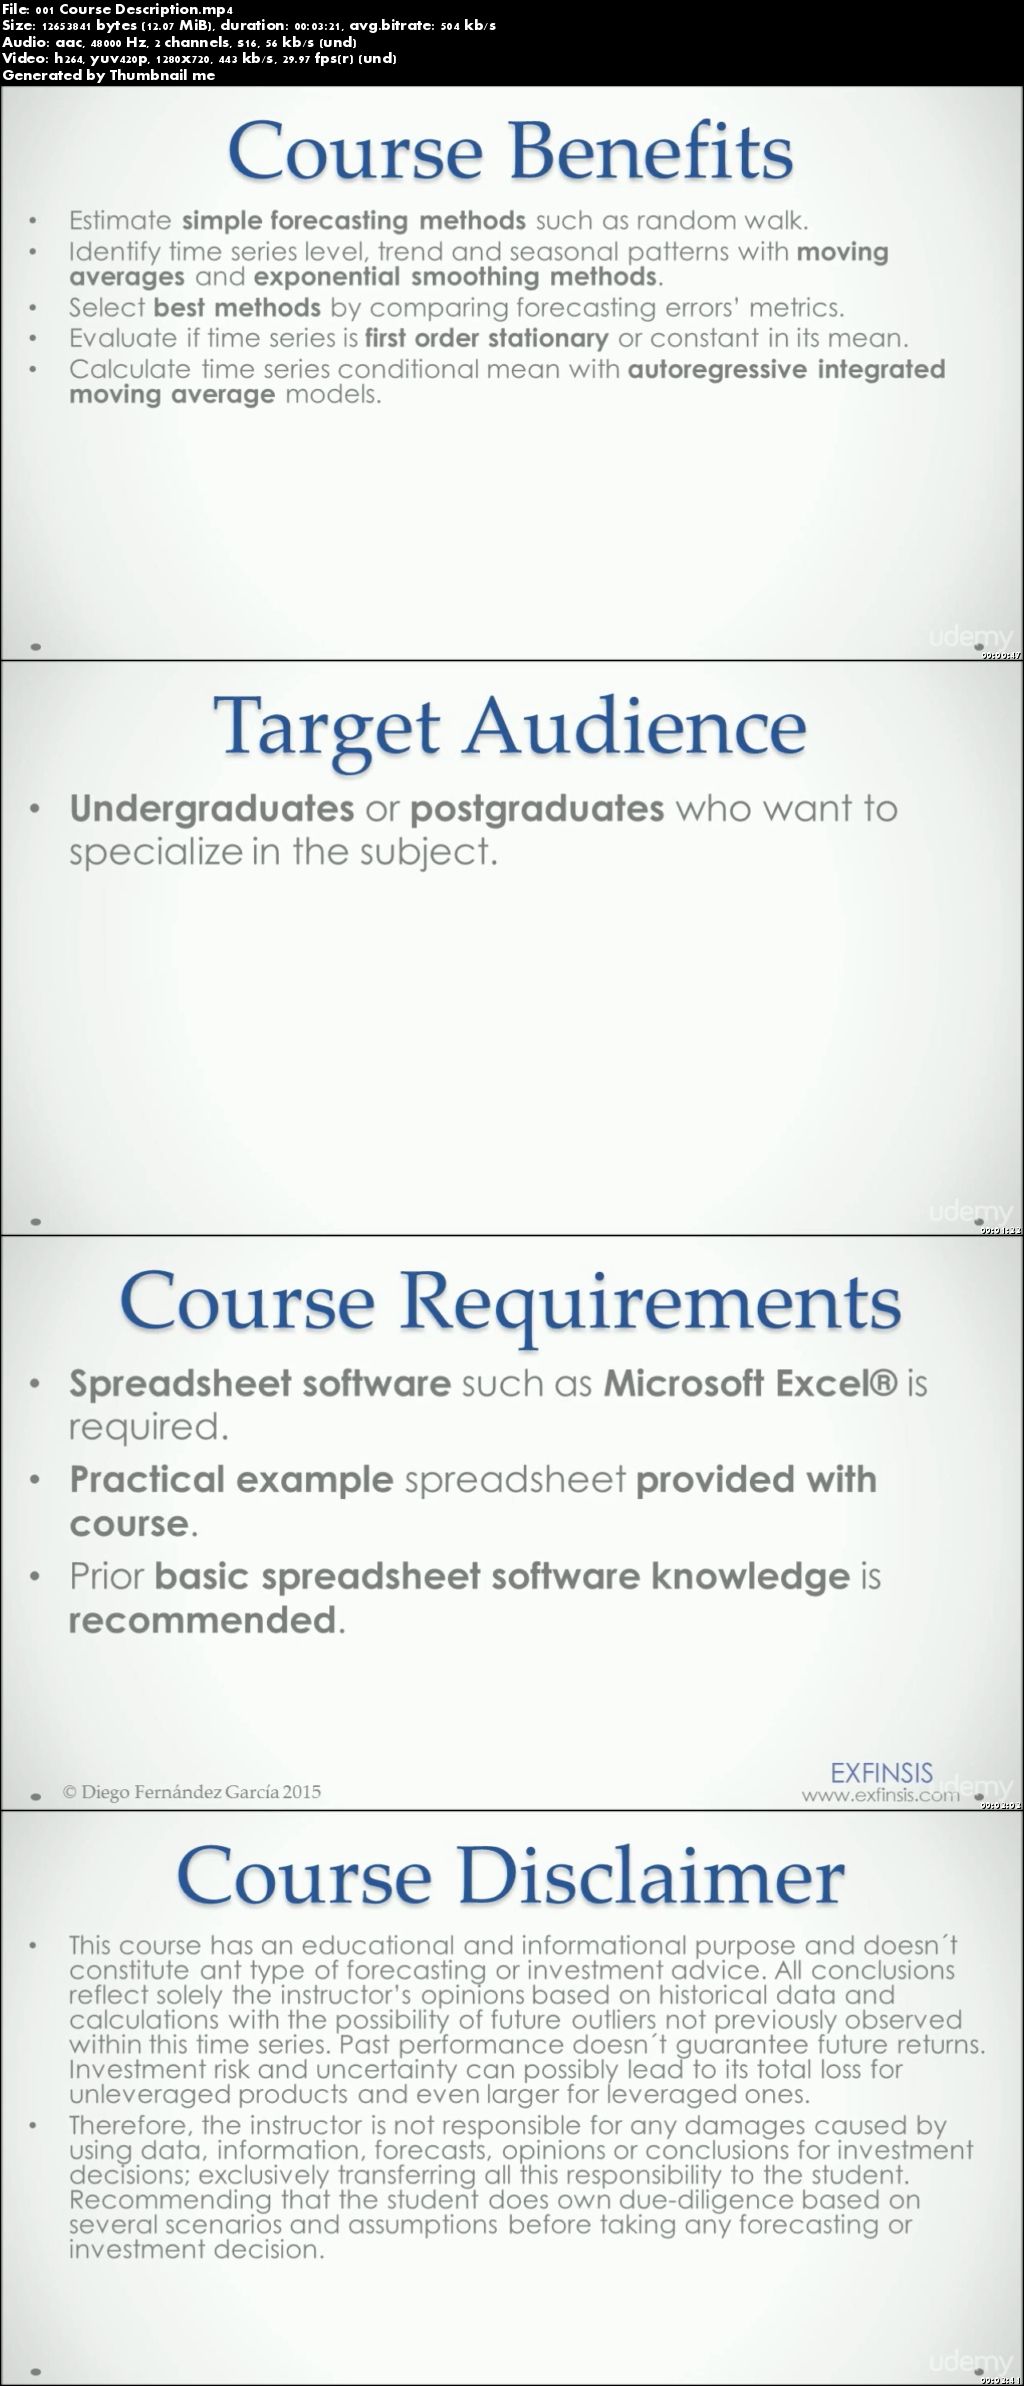
Estimate simple benchmarking methods such as random walk.
Identify time series patterns with moving averages and exponential smoothing methods.
Select best methods by comparing forecasting errors’ metrics.
Evaluate if time series is first order stationary or constant in its mean.
Calculate time series conditional mean with autoregressive integrated moving average (ARIMA) models.
Determine models’ parameters and evaluate if forecasting errors are white noise.
Choose best models by comparing forecasting errors’ information criteria.
Test models’ forecasting accuracy by comparing their predicting capabilities.
Become a Forecasting Models Expert and Put Your Knowledge in Practice
Learning forecasting methods and models is indispensable for business or financial analysts in areas such as sales and financial forecasting, inventory optimization, demand and operations planning, and cash flow management. It is also essential for academic careers in data science, applied statistics, operations research, economics, econometrics and quantitative finance. And it is necessary for any business forecasting related decision.
But as learning curve can become steep as complexity grows, this course helps by leading you through step by step real world practical examples for greater effectiveness.
Content and Overview
This practical course contains over 40 lectures and more than 7.5 hours of content. It’s designed for all forecasting models knowledge levels and a basic understanding of Excel is recommended.
At first, you’ll estimate simple forecasting methods such as naïve or random walk and use them as benchmarks against other more complex ones.
Then, you’ll identify time series level, trend and seasonality patterns through simple and weighted moving averages together with Brown’s, Holt’s, Gardner’s, Taylor’s and Winter’s exponential smoothing (ETS) methods. Next, you’ll select best methods by comparing scale-dependent and scale-independent forecasting errors’ metrics such as Hyndman and Koehler’s mean absolute scaled error.
After that, you’ll evaluate if time series is first order stationary with deterministic trend and seasonality together with augmented Dickey-Fuller test. Next, you’ll calculate time series conditional mean with Box-Jenkins’s autoregressive integrated moving average (ARIMA) models. Then, you’ll determine models’ parameters with autocorrelation, partial autocorrelation functions and use them to evaluate if forecasting residuals are white noise together with Ljung-Box test. And then, you’ll choose best models by comparing Akaike’s and Schwarz’s Bayesian information criteria.
Finally, you’ll test forecasting accuracy of methods and models by comparing their predicting capabilities.
Forecasting Models with Excel