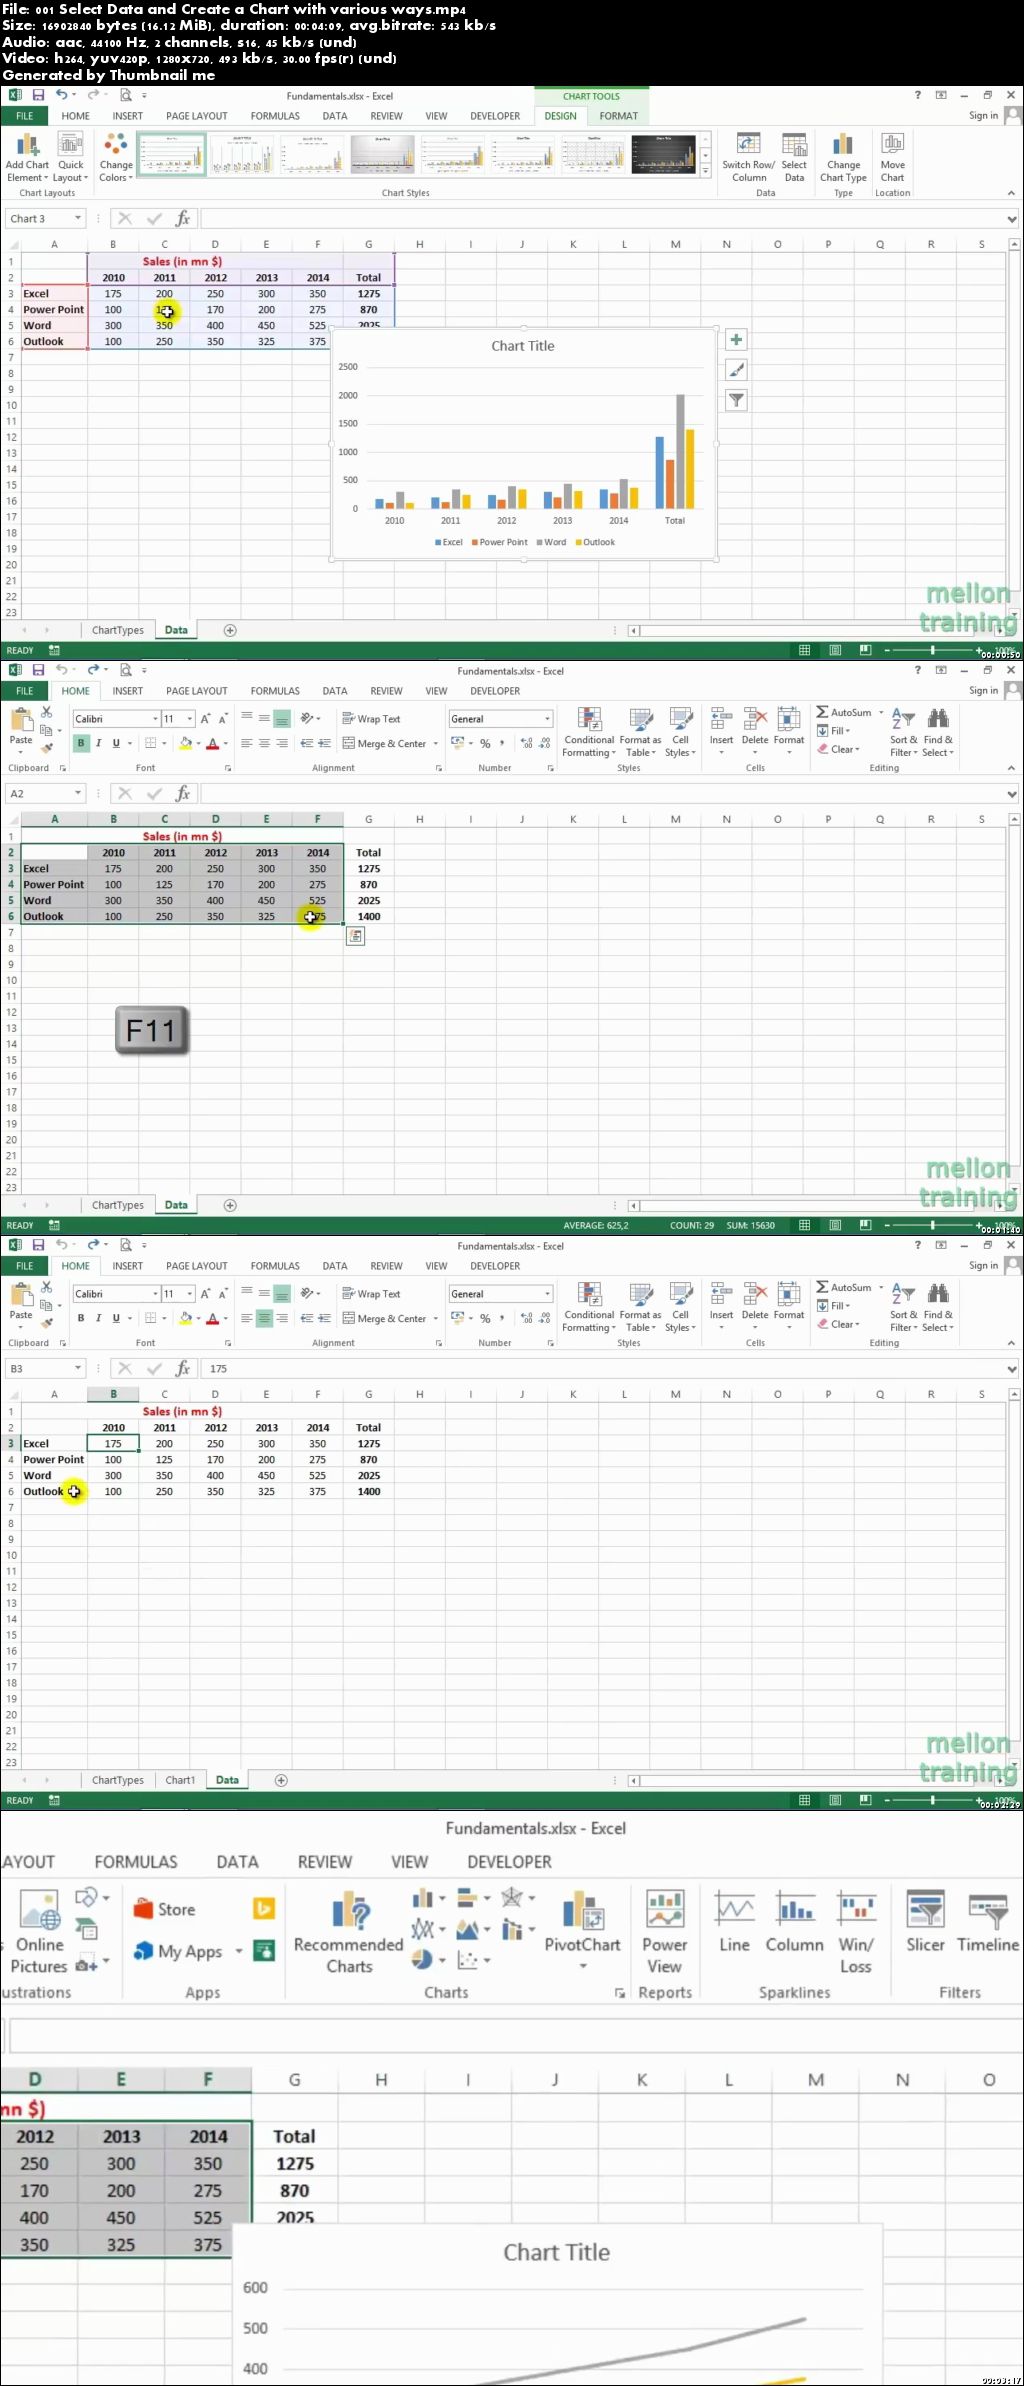
Excel Dashboards & Excel Charts

Excel Dashboards & Excel Charts
MP4 | Video: 1280x720 | 45 kbps | 44 KHz | Duration: 6 Hours | 1.17 GB
Genre: eLearning | Language: English
MP4 | Video: 1280x720 | 45 kbps | 44 KHz | Duration: 6 Hours | 1.17 GB
Genre: eLearning | Language: English
Create Interactive Excel Graphs, Pivot Charts and Excel Dashboards with Microsoft Excel 2013
Do you struggle drawing professional charts in Microsoft Excel?
Have you wasted your time searching countless hours for YouTube videos, trying to find useful content about Excel Graphs and Dashboards?
Do you want to learn how to make amazing Dynamic Excel Charts, Dashboards and Pivot Charts in a few weeks?
While Excel offers dozens of chart types and hundreds of formatting options, making the right chart is the trickiest part. In order to use charts effectively, you'll need to understand how different charts are used.
In this course my goal is to give my students the practical knowledge, with real-world examples and step by step instructions, to create professional and designer-quality Charts and Dashboards in Excel.
With over 90 Lectures, quizzes, assignments, real-life Excel projects+SAMPLES and weekly updates, learning advanced Excel techniques has never been easier. This course is a concise and practical go-to guide for creating Interactive Charts and awesome Dashboards in Microsoft Excel. It also expands in to Pivot Tables, Pivot Charts, Conditional Formatting, Functions, Formulas and Macros.
Excel Dashboards & Excel Charts