Lynda - Designing an Infographic
Lynda - Designing an Infographic
English | Apr 03, 2014 | .MP4 | Audio: aac, 44100 Hz, mono | Video: h264, yuv420p, 1280x720, 15.00 fps(r) | 732 MB
Genre: E-learning
English | Apr 03, 2014 | .MP4 | Audio: aac, 44100 Hz, mono | Video: h264, yuv420p, 1280x720, 15.00 fps(r) | 732 MB
Genre: E-learning
Make your data beautiful; turn it into an infographic. Infographics make complicated information easily understandable and visually compelling.
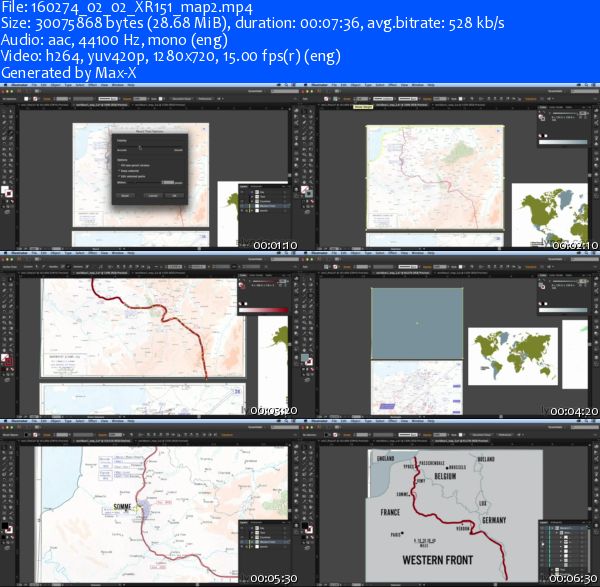
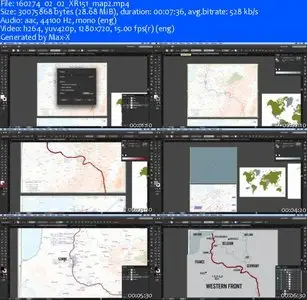
In this course, Nigel French memorializes the soldiers and events of World War I, but you can use these lessons to build almost any kind of infographic. Learn how to use Illustrator, InDesign, Photoshop, and Excel together to analyze and chart the data, plot locations on a map, and build a timeline that simply details a complex sequence of events. Along the way, Nigel explains how to choose fonts and color, create a background image, and finally convert your print graphic into a format suitable for websites.
Topics include:
Building a grid
Choosing colors and typefaces
Creating a map and diagram key
Creating a pie chart
Modifying stock images
Creating a timeline
Adding bulleted lists
More Info
Screenshot:
Lynda - Designing an Infographic