Creating Maps, Charts, and Infographics with Adobe Illustrator: Learn by Video

Creating Maps, Charts, and Infographics with Adobe Illustrator: Learn by Video
English | .FLV | h264, yuv420p, 1280x720, 25.00 fps(r) | aac, 44100 Hz, stereo | 4.95 GB
Genre: E-learning
English | .FLV | h264, yuv420p, 1280x720, 25.00 fps(r) | aac, 44100 Hz, stereo | 4.95 GB
Genre: E-learning
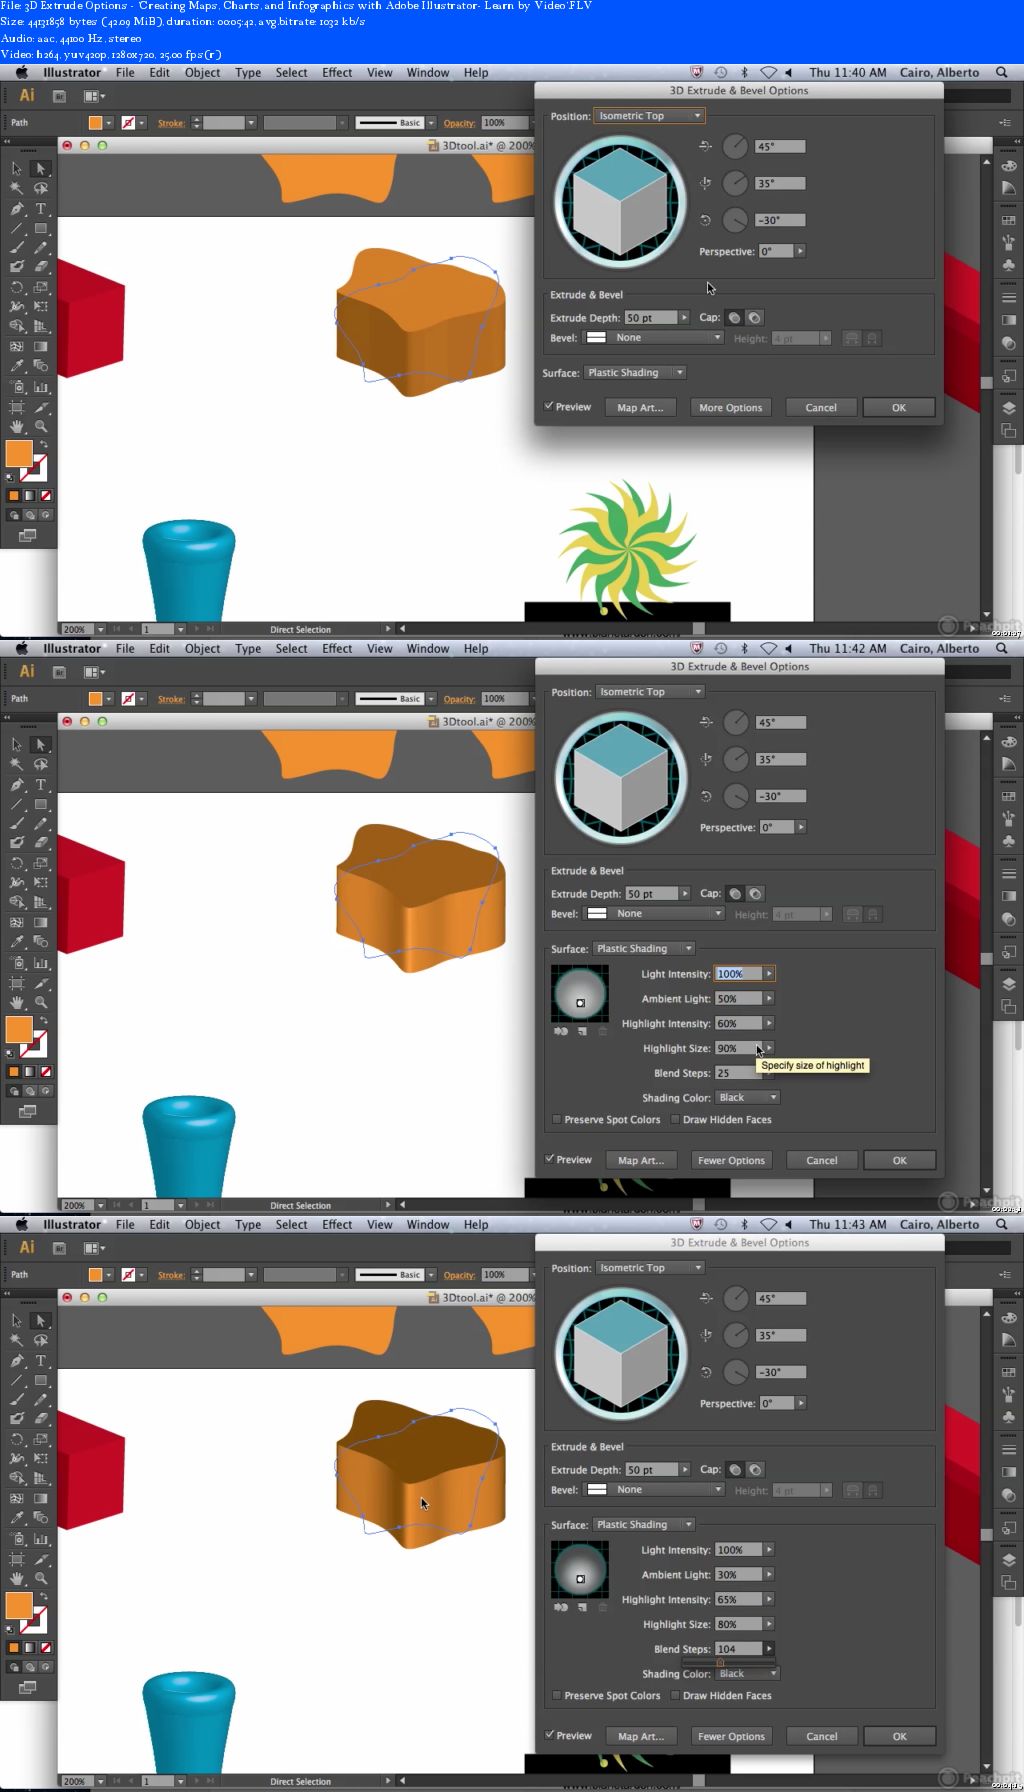
Learn how to create infographics, maps, and charts in this 12-hour, video based course to teach anyone who can hold a mouse how to use Adobe Illustrator to tell stories with data.
Acclaimed data visualization instructor and journalist Alberto Cairo provides you with a brief introduction to Adobe Illustrator’s tools and basic drawing techniques before diving into more advanced instructions specific to creating infographics. For example, if you’re already familiar with Illustrator, you can skip ahead to lessons that teach you how to use Illustrator’s Graph tool to design charts and greatly improve the look of your graphics. You’ll also learn how to trace maps; create complex, explanatory vector illustrations; use advanced coloring techniques; simulate 3D effects to create infographics in perspective; and use Illustrator’s Pen tool to draw just about anything.

Creating Maps, Charts, and Infographics with Adobe Illustrator: Learn by Video