

Building Interactive Dashboards with Tableau
Building Interactive Dashboards with Tableau
English | Monday, July 21, 2014 | ISBN-13: 9781782177302 | mp4 | H264 1280x720 | AAC 2 ch 159 kbps | 4 hrs 31 min | 996 MB
eLearning
English | Monday, July 21, 2014 | ISBN-13: 9781782177302 | mp4 | H264 1280x720 | AAC 2 ch 159 kbps | 4 hrs 31 min | 996 MB
eLearning
About This Video
- Increase your value to an organization by turning existing data into valuable, engaging business intelligence
- Master the dashboard planning process by knowing which charts to use and how to create a cohesive flow for your audience
- Includes best practices and efficient techniques to walk you through the creation of five progressively engaging dashboards
Who This Video Is For
If you are a data analyst looking for ways to create effective business dashboards at every level of your organization using Tableau, from Executive to Operations and Directors to Analysts, then this course is for you. Beginner-level understanding of how to use Tableau is expected.
What You Will Learn
- Develop intuitive and informative executive-level dashboards with the appropriate depth of interactivity
- Empower tactical teams to track progress and opportunities using charts and interactivity that quickly surfaces key insights
- Create engaging Operational dashboards to monitor pipeline activities and drive team KPIs
- Expose advanced analytical tools to analysts and others who need to dive in deep to explore the data
- Produce customized visualizations of data to support the decision processes of your stakeholders
- Deliver your finished dashboard with an informative user interface that guides, informs, and amazes your audience
- Publish and distribute your work confidently using the best methods and options for your audience
In Detail
As businesses collect increasing amounts of vital data, the need for effective, intuitive, and actionable interfaces increases every day. Tableau is part of a new class of business intelligence tools, which dramatically reduce the time and technical acumen required to derive insights from data and publish it in a consumable format.
We'll begin by laying the groundwork for a successful dashboard and then move on to constructing five different dashboards of increasing complexity.
Starting with the Strategic/Executive dashboard, we’ll design a few of the most common dashboard elements and assemble our first complete dashboard. Next, we’ll show you how to use Tactical dashboards for visualizations that can help depict progress and draw attention to important areas. We’ll then dive into increasing the dashboard interactivity by using Operational dashboards when focusing on granular detail. Using advanced techniques in Tableau, we’ll then show you how to use Analytical dashboards that can provide you with the tools to effectively extract knowledge from your data. We’ll also walk through how to quickly create a visualization using Ad-hoc dashboards that allow you to effectively keep an eye on a specific area of interest. Lastly, we’ll cover the styling settings and publication options and conclude with best practices.
This course guides you through the entire “how and why” of each task in the dashboard creation process, which will translate easily to your own dashboard projects.
Authors
Tony Kau
Tony Kau is a Tableau Desktop 8 Qualified Associate, and he is putting its power to use in his role as a reporting analyst for a Fortune 500 company. His analytical background spans a decade, during which he has used a variety of business intelligence software, though none were better than Tableau. His passion is efficiently leveraging data to inform strategic business decisions.
He holds a degree in Business Administration from the University of Oregon, and his background includes web design, programming, and financial analysis. He currently operates TrendExhaustion.com in his spare time.
Table of Contents
- Exploring Possibilities and Positioning for Success
- Strategic or Executive Dashboards
- Tactical Dashboards
- Operational Dashboards
- Analytical Dashboards
- Ad-hoc Dashboards
- Customizing and Styling Your Dashboard
- Dashboard Publication
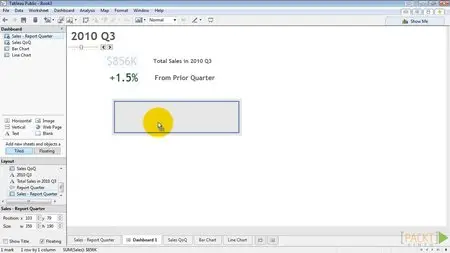
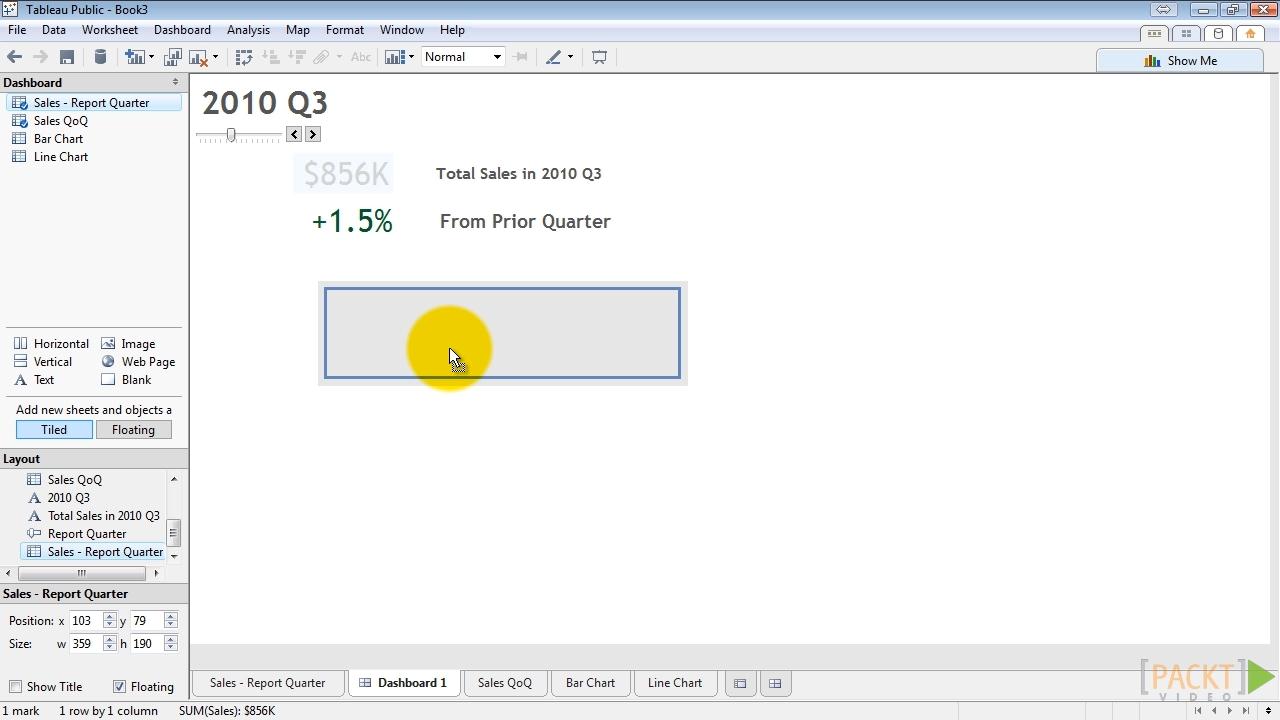
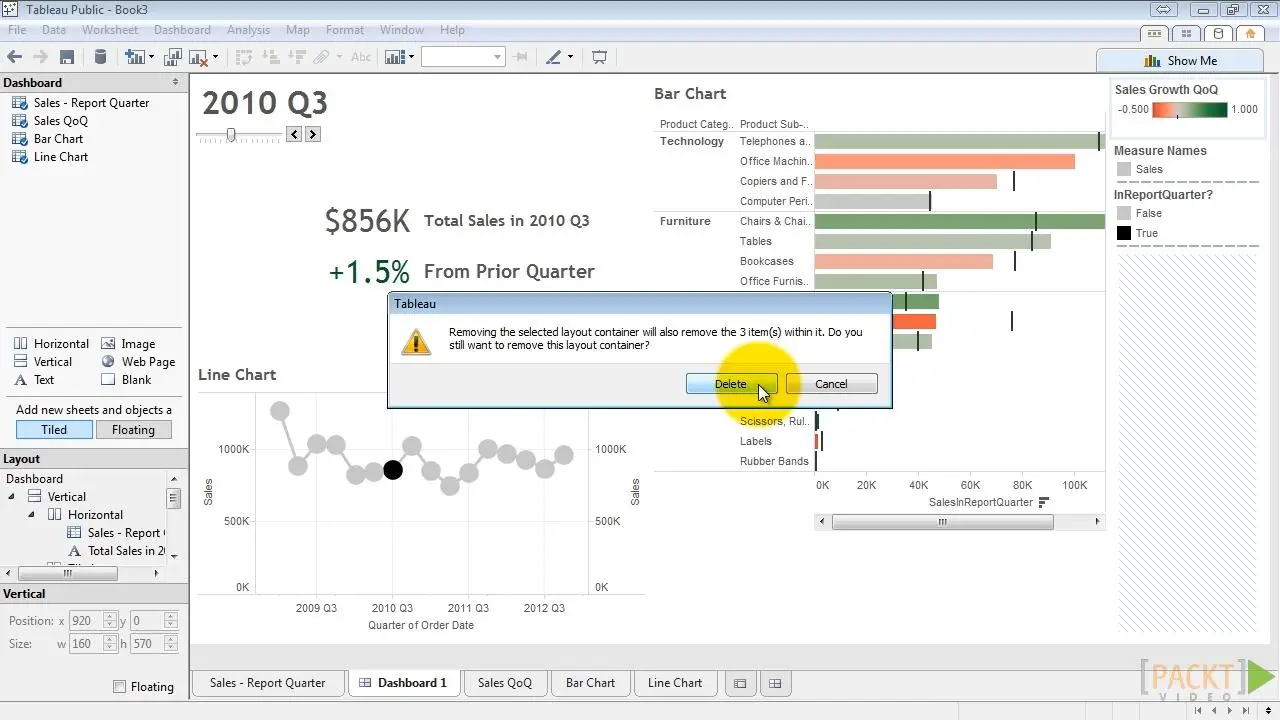
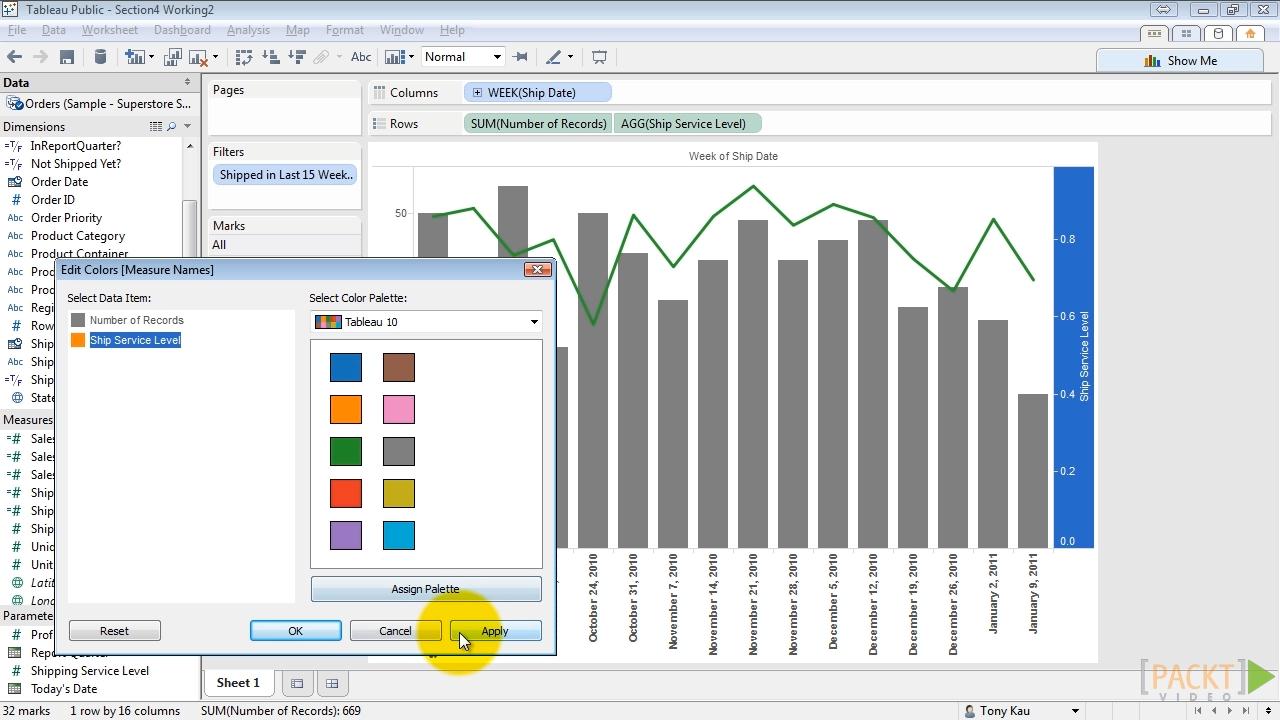
Screenshots:
Building Interactive Dashboards with Tableau

Building Interactive Dashboards with Tableau
Building Interactive Dashboards with Tableau
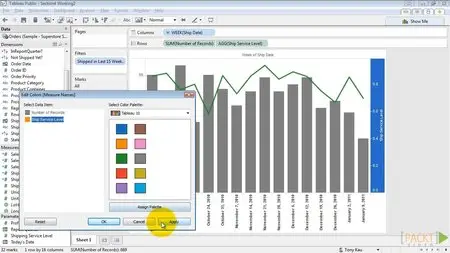
Building Interactive Dashboards with Tableau

Building Interactive Dashboards with Tableau
