


Regression Analysis
Regression Analysis
WEBRip | MP4/AVC, ~690 kb/s | 1280 x 720| English: AAC, 66.2 kb/s (2 ch), 44.1 KHz | 643 MB
Genre: Business / Data & Analytics | Language: English | +Project Files
WEBRip | MP4/AVC, ~690 kb/s | 1280 x 720| English: AAC, 66.2 kb/s (2 ch), 44.1 KHz | 643 MB
Genre: Business / Data & Analytics | Language: English | +Project Files
Regression Data Analytics with SPSS and Microsoft Excel
This course covers running and evaluating linear regression models (simple regression, multiple regression, and hierarchical regression), including assessing the overall quality of models and interpreting individual predictors for significance. We also explore R-Square in depth, including how to interpret R-Square for significance. Together with in-depth coverage of simple, multiple and hierarchical regression, we'll also explore correlation, which is closely related to regression analysis. By the end of this course you will be skilled in running and interpreting your own linear regression analyses, as well as critically evaluating the work of others. Examples of running regression in both SPSS and Excel provided. Lectures provided in HD video with course quizzes also provided. Taught by a PhD award-winning university instructor with over 15 years of teaching experience. While you can be confident that you are getting accurate information with Quantitative Specialists, we also make it our highest priority in creating crystal-clear, easy-to-follow videos. Be confused by regression no longer – Enroll Today!
What are the requirements?
- Many of the videos use SPSS in running regression models and some use the Excel Data Analysis ToolPak. While SPSS is not required to understand the material or follow the videos, if you want to reproduce the analyses on your own, SPSS will be required. However, other software (such as R, SAS, or Minitab) can be used to reach the same statistical decisions about the regressions models (as are illustrated here).
What am I going to get from this course?
- Over 16 lectures and 2 hours of content!
- Understand when to use simple, multiple, and hierarchical regression
- Understand the meaning of R-Square and the role it plays in regression
- Assess a regression model for statistical significance, including both the overall model and the individual predictors
- Effectively utilize regression models in your own work and be able to critically evaluate the work of others
- Understand predicted values and their role in the overall quality of a regression model
- Understand hierarchical regression, including its purpose and when it should be used
- Use regression for assessing the relative value of competing predictors
- Make business decisions about the best models to maximize profits while minimizing risk
- Learn how to conduct correlation and regression using both IBM SPSS and Microsoft Excel
What is the target audience?
- Anyone interested in learning more about regression analysis.
- It is not for those looking for an general introduction to statistics course. For this we recommend taking a look at our descriptive statistics or inferential statistics courses. (This course specializes in regression analysis.)
Curriculum
Section 1: Introduction
Lecture 1 Introduction 05:58
In this video, the author background, an overview of the topics covered, and the goals of the course are described.
Lecture 2 Correlation - Part 1 06:47
In this video we take at an example using correlation, which measures the linear relationship between two variables (Part 1 of 2).
Note: The SPSS data files for the entire course can be downloaded here.
Lecture 3 Correlation - Part 2 07:38
In this video we take at an example using correlation, which measures the linear relationship between two variables (Part 2 of 2).
Note: A copy of the SPSS output is provided (as Downloadable material) with this lecture.
Lecture 4 Correlation With More Than Two Variables 04:28
In this video we look at correlation between a number of different variables, with two variables correlated at a time. The resulting output produces a correlation matrix, which is a table of correlations. This example uses Microsoft Excel.
Note: The Excel data file and a copy of the output are provided (as Downloadable materials) with this lecture.
Quiz 1 Correlation 4 questions
Section 2: Simple Regression - One Predictor (or IV)
Lecture 5 Simple Regression - Example 1 (Part 1) 10:26
This video covers simple regression, which is used when there is one predictor (independent variable) and one criterion (dependent variable). (Part 1 of 2)
Note: The SPSS data files for the entire course are located in the Correlation - Part 1 folder.
Lecture 6 Simple Regression - Example 1 (Part 2) 06:46
This video covers simple regression, which is used when there is one predictor (independent variable) and one criterion (dependent variable). (Part 2 of 2)
Note: A copy of the SPSS output is provided (as Downloadable material) with this lecture.
Lecture 7 Simple Regression - Example 2 11:22
This video covers a second example on simple regression.
Note: A copy of the SPSS output is provided (as Downloadable material) with this lecture.
Quiz 2 Simple Regression 4 questions
Section 3: Multiple Regression - 2+ Predictors (IVs)
Lecture 8 Multiple Regression - Part 1 06:42
This video covers multiple regression, which is used when there are two or more predictors (independent variables) and one criterion (dependent variable). (Part 1 of 2)
Note: The SPSS data files for the entire course are located in the Correlation - Part 1 folder.
Lecture 9 Multiple Regression - Part 2 09:03
This video covers multiple regression, which is used when there are two or more predictors (independent variables) and one criterion (dependent variable). (Part 2 of 2)
Note: A copy of the SPSS output is provided (as Downloadable material) with this lecture.
Lecture 10 Finding Predicted Values - Part 1 07:24
This video covers how to find predicted values in regression. Predicted values can be solved for in both simple and multiple regression (Part 1 of 2).
Note: The SPSS data files for the entire course are located in the Correlation - Part 1 folder.
Lecture 11 Finding Predicted Values - Part 2 09:18
This video covers how to find predicted values in regression. Predicted values can be solved for in both simple and multiple regression.(Part 2 of 2)
Note: A copy of the SPSS output is provided (as Downloadable material) with this lecture.
Quiz 3 Multiple Regression 6 questions
Section 4: Hierarchical Regression - 2+ Predictors (with order of entry)
Lecture 12 Hierarchical Regression - Part 1 11:08
This video covers hierarchical regression, which is used when predictors are entered in multiple steps. Hierarchical regression allows one to assess the unique effect of one or more predictors that are added to the model in a later step in the analysis. (Part 1 of 2)
Note: The SPSS data files for the entire course are located in the Correlation - Part 1 folder.
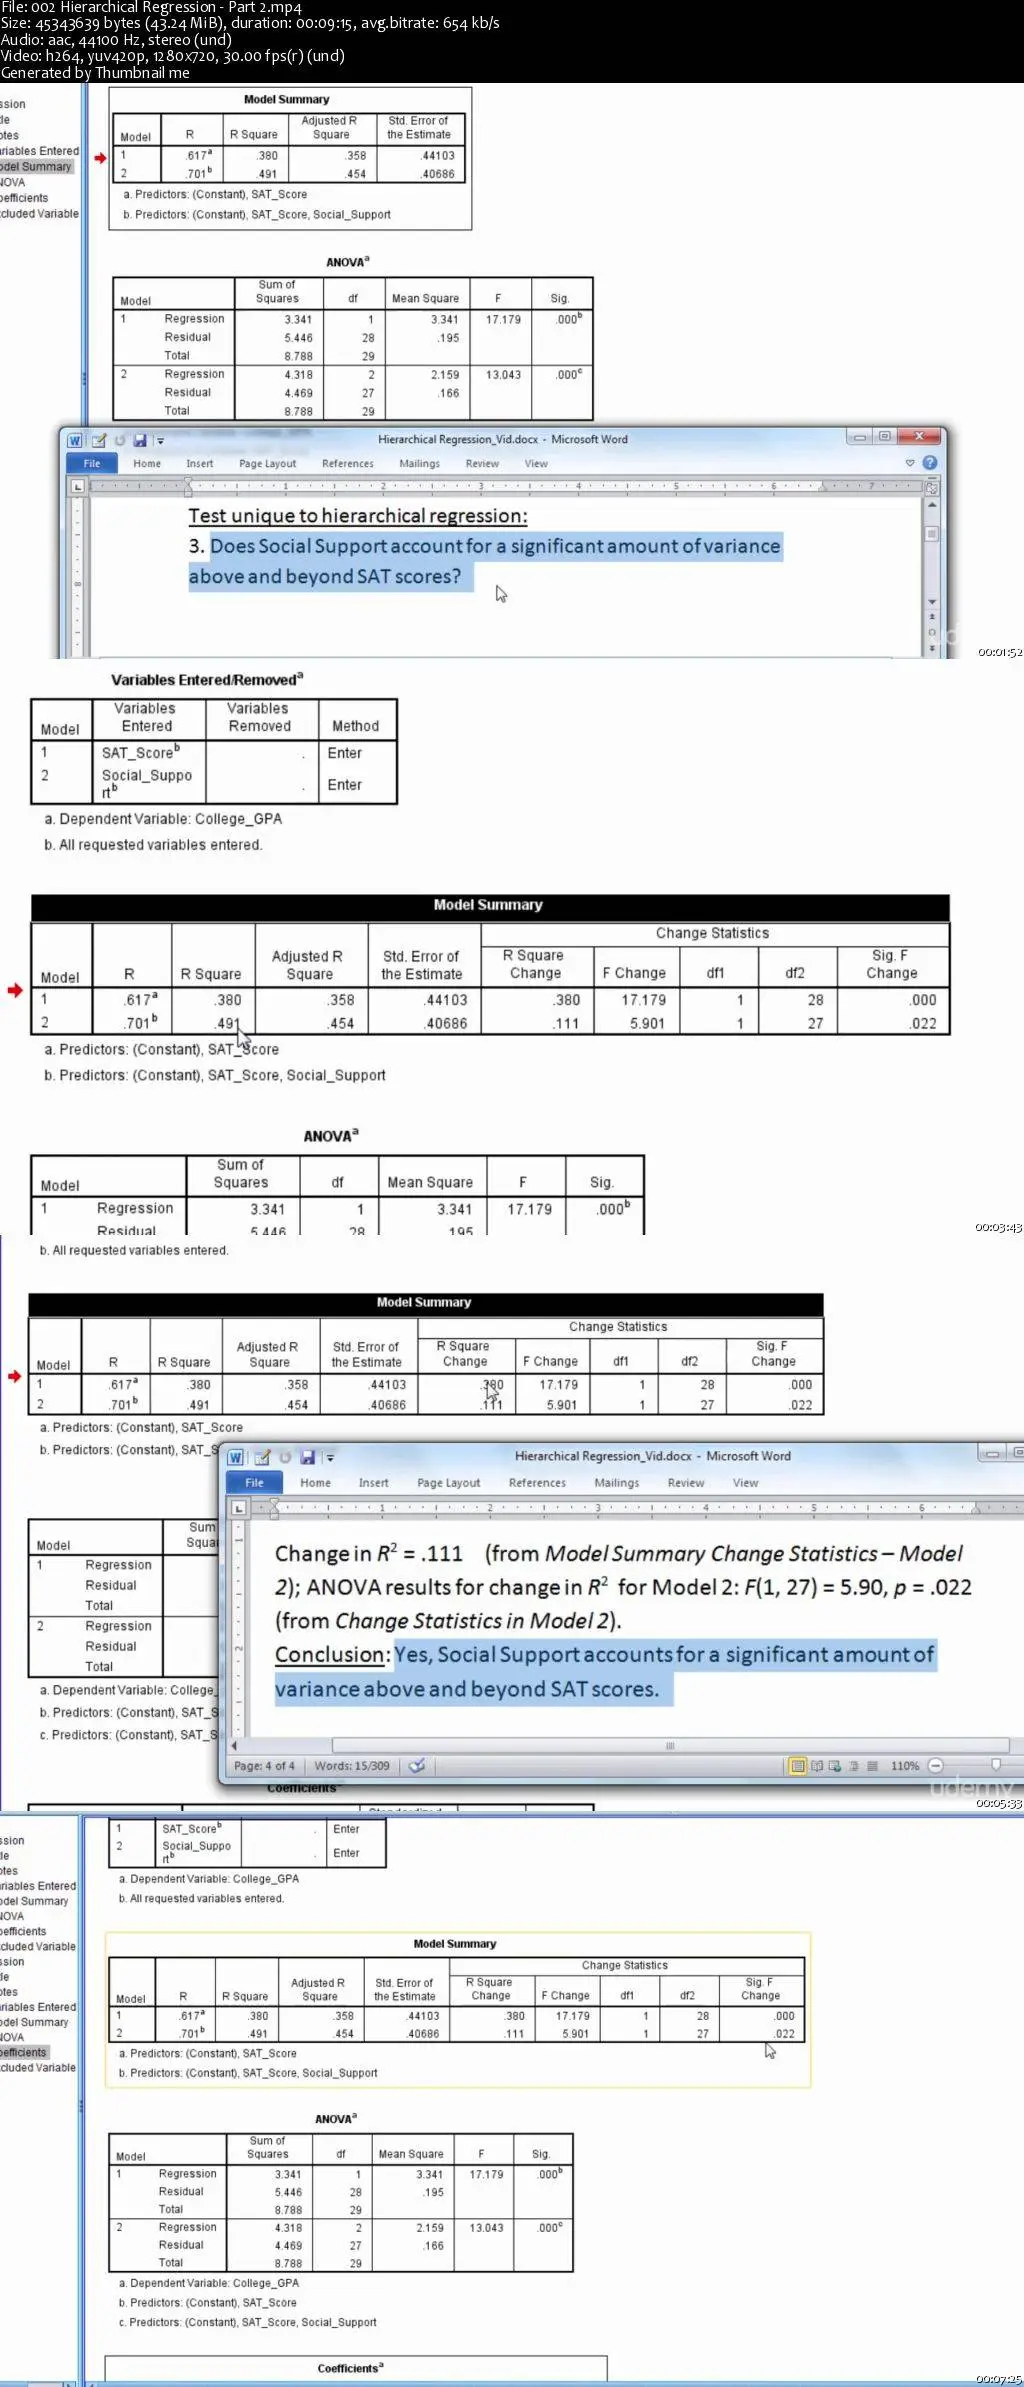
Lecture 13 Hierarchical Regression - Part 2 09:15
This video covers hierarchical regression, which is used when predictors are entered in multiple steps. Hierarchical regression allows one to assess the unique effect of one or more predictors that are added to the model in a later step in the analysis. (Part 2 of 2)
Note: A copy of the SPSS output is provided (as Downloadable material) with this lecture.
Quiz 4 Hierarchical Regression 4 questions
Section 5: Regression in Microsoft Excel
Lecture 14 Multiple Regression in Excel - Part 1 06:41
This video covers multiple regression in Microsoft Excel, for those who would like to see how to use Excel to run a regression (Part 1 of 2). Along with the quantitative predictors of SAT score and social support, we also have a categorical variable, gender, in this example.
Multiple regression is used when there are two or more predictors (independent variables) and one criterion (dependent variable).
Note: The data files for the entire course are located in the Correlation - Part 1 folder.
Lecture 15 Multiple Regression in Excel - Part 2 09:36
This video covers multiple regression in Microsoft Excel, for those who would like to see how to use Excel to run a regression (Part 2 of 2). Along with the quantitative predictors of SAT score and social support, we also have a categorical variable, gender, in this example.
Multiple regression is used when there are two or more predictors (independent variables) and one criterion (dependent variable).
Note: The Excel data file and a copy of the output are provided (as Downloadable materials) with this lecture.
Section 6: Conclusion
Lecture 16 Course Conclusion 01:15
The conclusion to the course is presented in this video along with a brief introduction to some of the other courses available by Quantitative Specialists
Regression Analysis
LabView - Collective Books
Mega E-books Pack (2013)
Malware Centric E-book Collection
Huge Electricity, Magnetism, A..., Healing - EBooks Collection
Premium IT eBooks Collection
Huge Encyclopedias - EBooks Collection
Osprey Publishing - Military History Books Collection
Gale Encyclopedias - Full Pack
IT Books Collection (Basic - Intermediate - Advance)
Medicinal and Aromatic Plants - 50 Volume Set
Doctor Who ebooks Collection
Learning HTML Ultimate Collection
Comprehensive Robotics Books Collection
Great Royal Web Design Pack
Civil Engineering Geotechnical books
Luftwaffe Colours Collection
Many Thanks to Original uploader.
For More Rare Movies Check out my blog!
Download Links:
No Mirrors Please