


O'Reilly Media - Learning Path: Data Visualization
O'Reilly Media - Learning Path: Data Visualization
English | MP4 | 1280x720 | AVC 970 Kbps 29.970 fps | AAC 1500 Kbps 44.1 khz | 14 Hours | 3.75 GB
Sample Files: present
Genre: Video Training
English | MP4 | 1280x720 | AVC 970 Kbps 29.970 fps | AAC 1500 Kbps 44.1 khz | 14 Hours | 3.75 GB
Sample Files: present
Genre: Video Training
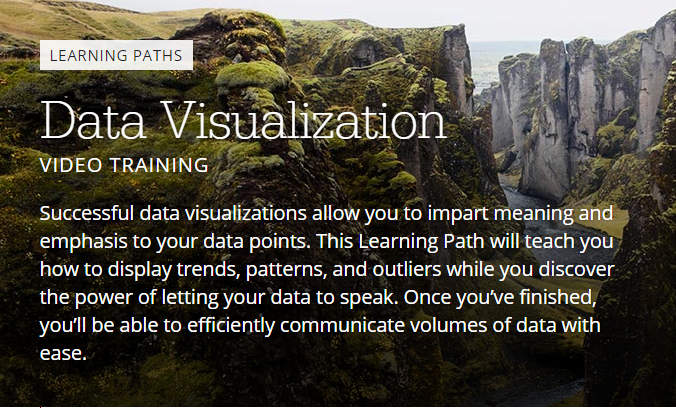
Successful data visualizations allow you to impart meaning and emphasis to your data points. This Learning Path will teach you how to display trends, patterns, and outliers while you discover the power of letting your data speak. Once you've finished, you'll be able to efficiently communicate volumes of data with ease.
An Introduction to d3.js: From Scattered to Scatterplot
Presented by Scott Murray
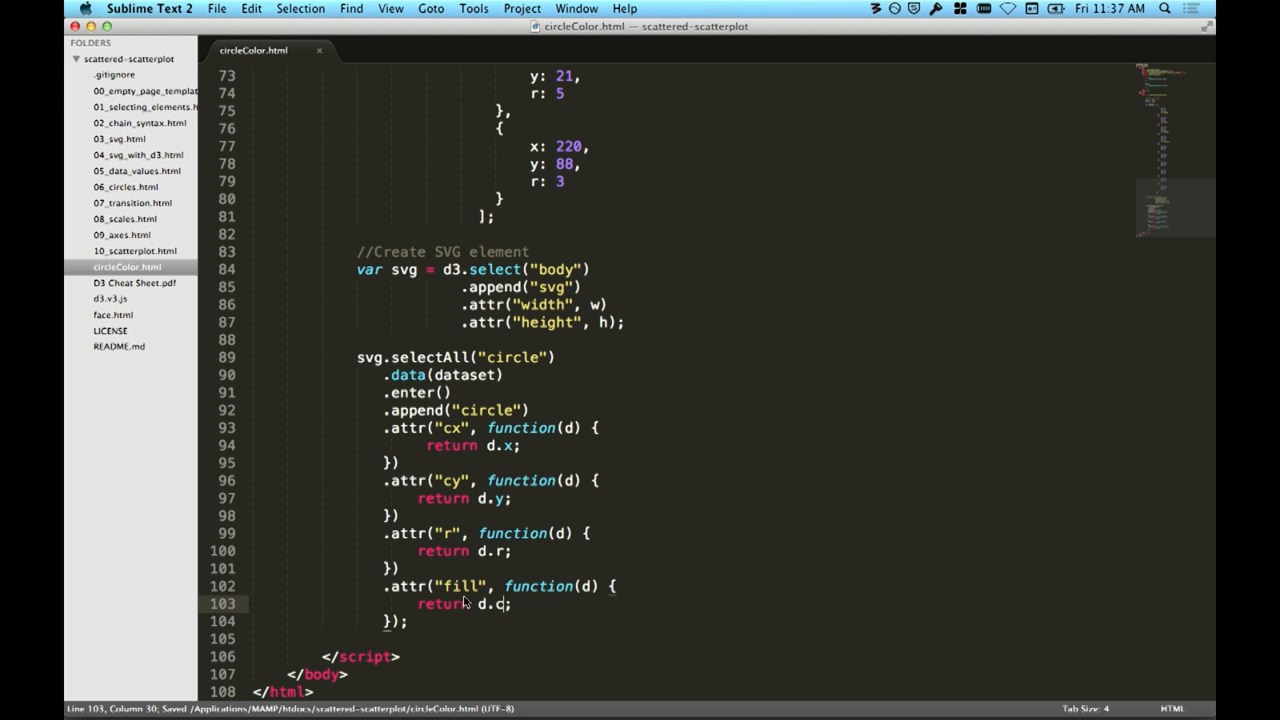
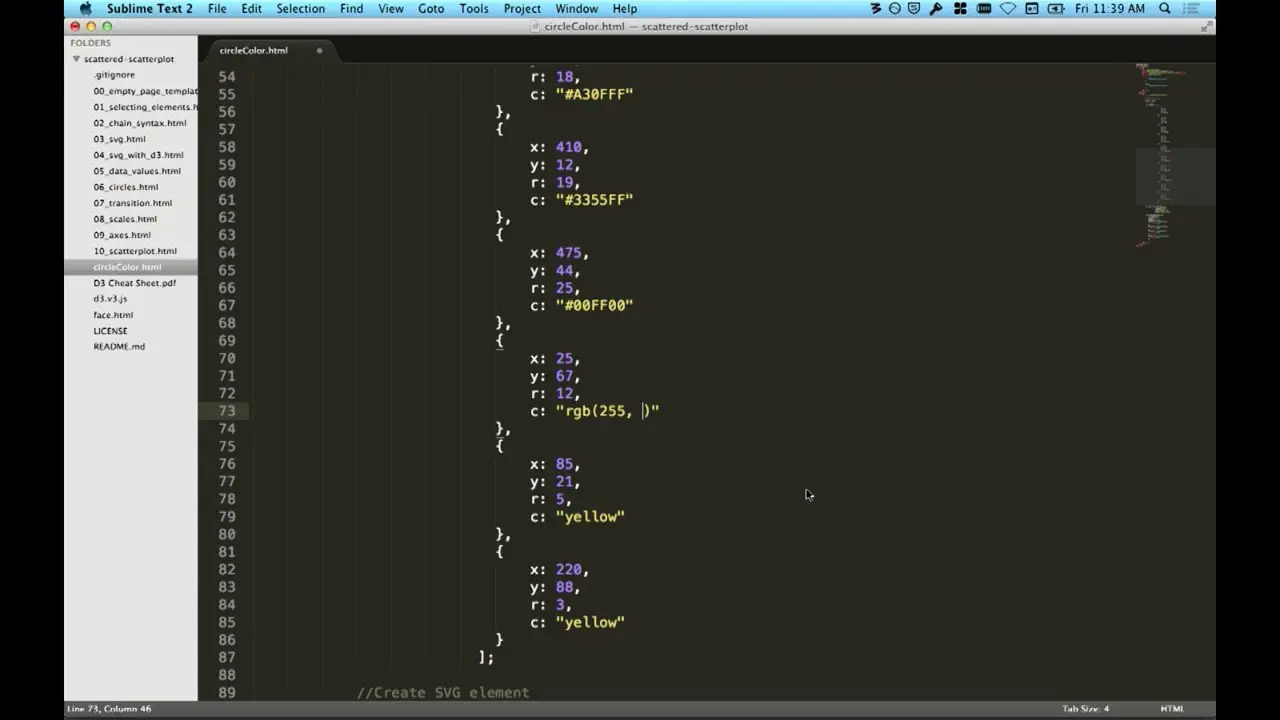
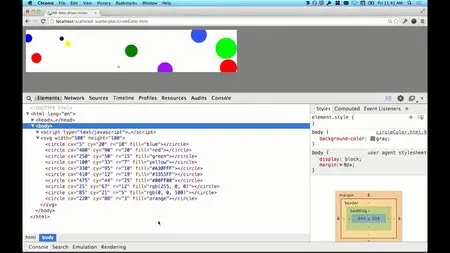
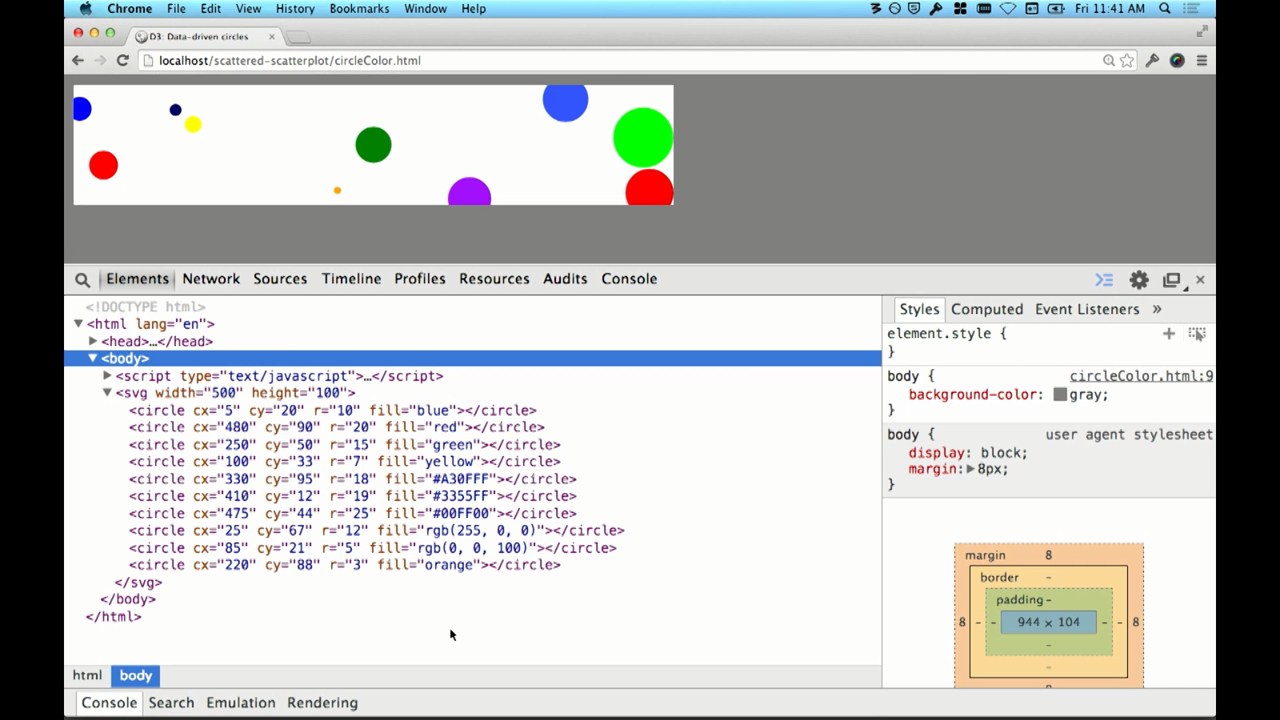
This segment of your Learning Path will have you transforming data into visual images in no time, starting from scratch and building an interactive scatterplot by the end of the course. Learn to use d3.js, the web’s most powerful library for data visualization, to load data and translate values into SVG elements.
Learning to Visualize Data with D3.js
Presented by Rafael Hernandez
Add to your D3 skills as you build data visualizations with the D3 JavaScript library. You’ll start by learning how to bind data from JavaScript arrays to elements, scale data, and style simple data visualizations with CSS. From there, you’ll learn how to add interactivity to your data visualization to make it even more powerful.
Using Storytelling to Effectively Communicate Data
Presented by Michael Freeman
Learn how to use stories to introduce complex graphics in ways that entice and engage your audience. You’ll discover how storytelling can ensure clarity, humanize content, and allow you to present complex information using data visualization.
Effective Data Visualization
Presented by Jeff Heer
In this course, you’ll acquire best practices for designing interactive visualizations, performing exploratory data analysis, and examining multidimensional data. You’ll start with an exploration of design principles drawn from graphic design, visual art, perceptual psychology, and cognitive science. You’ll also learn techniques for scaling visualizations to extremely large data sets.
Intermediate D3.js
Presented by Scott Murray
Expand your D3.js expertise as you learn how to work with charts, data layouts, and maps through several code examples. You’ll see how easily you can create beautiful, interactive, browser-based data visualizations with the D3 JavaScript library. Discover the power of D3.js for interactive maps, charts, and more.
Presented by Scott Murray
This segment of your Learning Path will have you transforming data into visual images in no time, starting from scratch and building an interactive scatterplot by the end of the course. Learn to use d3.js, the web’s most powerful library for data visualization, to load data and translate values into SVG elements.
Learning to Visualize Data with D3.js
Presented by Rafael Hernandez
Add to your D3 skills as you build data visualizations with the D3 JavaScript library. You’ll start by learning how to bind data from JavaScript arrays to elements, scale data, and style simple data visualizations with CSS. From there, you’ll learn how to add interactivity to your data visualization to make it even more powerful.
Using Storytelling to Effectively Communicate Data
Presented by Michael Freeman
Learn how to use stories to introduce complex graphics in ways that entice and engage your audience. You’ll discover how storytelling can ensure clarity, humanize content, and allow you to present complex information using data visualization.
Effective Data Visualization
Presented by Jeff Heer
In this course, you’ll acquire best practices for designing interactive visualizations, performing exploratory data analysis, and examining multidimensional data. You’ll start with an exploration of design principles drawn from graphic design, visual art, perceptual psychology, and cognitive science. You’ll also learn techniques for scaling visualizations to extremely large data sets.
Intermediate D3.js
Presented by Scott Murray
Expand your D3.js expertise as you learn how to work with charts, data layouts, and maps through several code examples. You’ll see how easily you can create beautiful, interactive, browser-based data visualizations with the D3 JavaScript library. Discover the power of D3.js for interactive maps, charts, and more.
General
Complete name : 01. An Introduction to d3.js From Scattered to Scatterplot, by Scott Murray\001_introduction.mp4
Format : MPEG-4
Format profile : Base Media
Codec ID : isom
File size : 15.7 MiB
Duration : 12mn 34s
Overall bit rate mode : Variable
Overall bit rate : 175 Kbps
Writing application : Lavf55.19.104
Video
ID : 2
Format : AVC
Format/Info : Advanced Video Codec
Format profile : Main@L3.1
Format settings, CABAC : Yes
Format settings, ReFrames : 4 frames
Codec ID : avc1
Codec ID/Info : Advanced Video Coding
Duration : 12mn 34s
Bit rate : 970 Kbps
Nominal bit rate : 1 500 Kbps
Width : 1 280 pixels
Height : 720 pixels
Display aspect ratio : 16:9
Frame rate mode : Constant
Frame rate : 29.970 fps
Color space : YUV
Chroma subsampling : 4:2:0
Bit depth : 8 bits
Scan type : Progressive
Bits/(Pixel*Frame) : 0.035
Stream size : 87.3 MiB
Writing library : x264 core 138
Encoding settings : cabac=1 / ref=1 / deblock=1:0:0 / analyse=0x1:0x111 / me=hex / subme=5 / psy=1 / psy_rd=1.00:0.00 / mixed_ref=0 / me_range=16 / chroma_me=1 / trellis=1 / 8x8dct=0 / cqm=0 / deadzone=21,11 / fast_pskip=1 / chroma_qp_offset=0 / threads=4 / lookahead_threads=1 / sliced_threads=0 / nr=0 / decimate=1 / interlaced=0 / bluray_compat=0 / constrained_intra=0 / bframes=3 / b_pyramid=2 / b_adapt=1 / b_bias=0 / direct=1 / weightb=1 / open_gop=0 / weightp=2 / keyint=60 / keyint_min=20 / scenecut=40 / intra_refresh=0 / rc_lookahead=40 / rc=cbr / mbtree=1 / bitrate=1500 / ratetol=1.0 / qcomp=0.60 / qpmin=10 / qpmax=50 / qpstep=4 / vbv_maxrate=1500 / vbv_bufsize=1200 / nal_hrd=none / ip_ratio=1.41 / aq=1:1.00
Audio
ID : 1
Format : AAC
Format/Info : Advanced Audio Codec
Format profile : LC
Codec ID : 40
Duration : 12mn 34s
Bit rate mode : Variable
Bit rate : 128 Kbps
Maximum bit rate : 1 500 Kbps
Channel(s) : 2 channels
Channel(s)_Original : 1 channel
Channel positions : Front: C
Sampling rate : 44.1 KHz
Compression mode : Lossy
Stream size : 11.5 MiB (73%)
Screenshots
O'Reilly Media - Learning Path: Data Visualization
O'Reilly Media - Learning Path: Data Visualization
O'Reilly Media - Learning Path: Data Visualization

O'Reilly Media - Learning Path: Data Visualization
