Lynda - Infographics Visualizing Relationships
Lynda - Infographics Visualizing Relationships
MOV | 960x540 | x264 | English AAC 1.0 @ 96 Kbps | 00:50:47 | 89 Mb
Genre: eLearning
MOV | 960x540 | x264 | English AAC 1.0 @ 96 Kbps | 00:50:47 | 89 Mb
Genre: eLearning
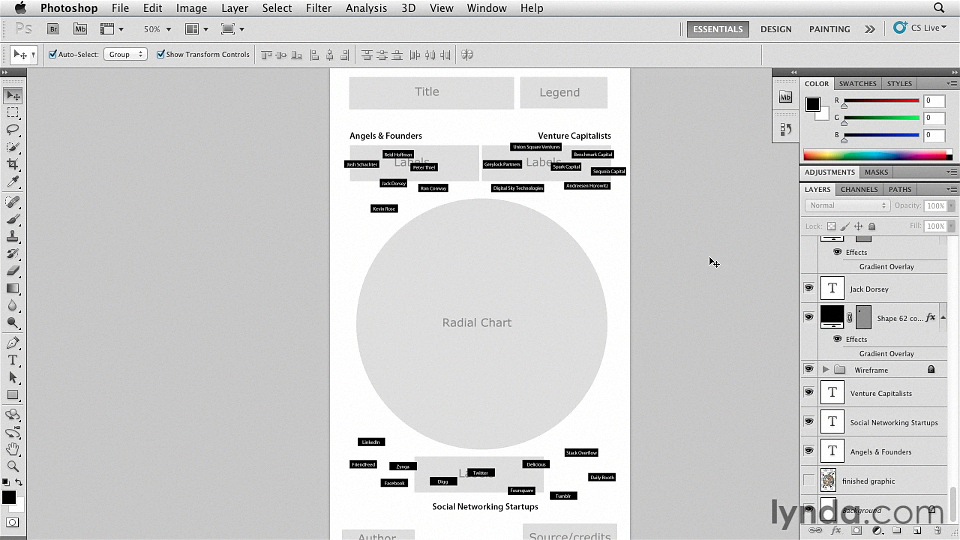
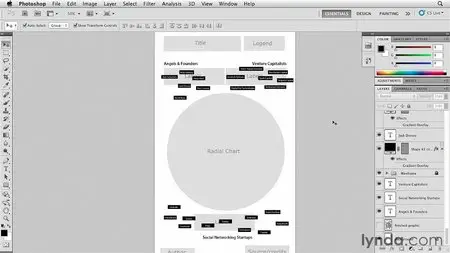
In this course, author Shane Snow shows how to depict complex relationships in an easy-to-understand infographic, or graphic representation of data. The course covers building a multi-relationship radial diagram, illustrating connections between relationships, and creating legends, as well as designing title and source credits and adjusting the placement of design elements post-illustration.
Topics include:
Setting the stage for a circle relationship visualization
Using space to organize the infographic
Drawing relationship lines with the Pen tool
Adjusting the curvature and transparency of lines
Adding directional arrows
Lynda - Infographics Visualizing Relationships