

LiveLessons - Statistical Analysis Using Excel, Volume I
LiveLessons - Statistical Analysis Using Excel, Volume I
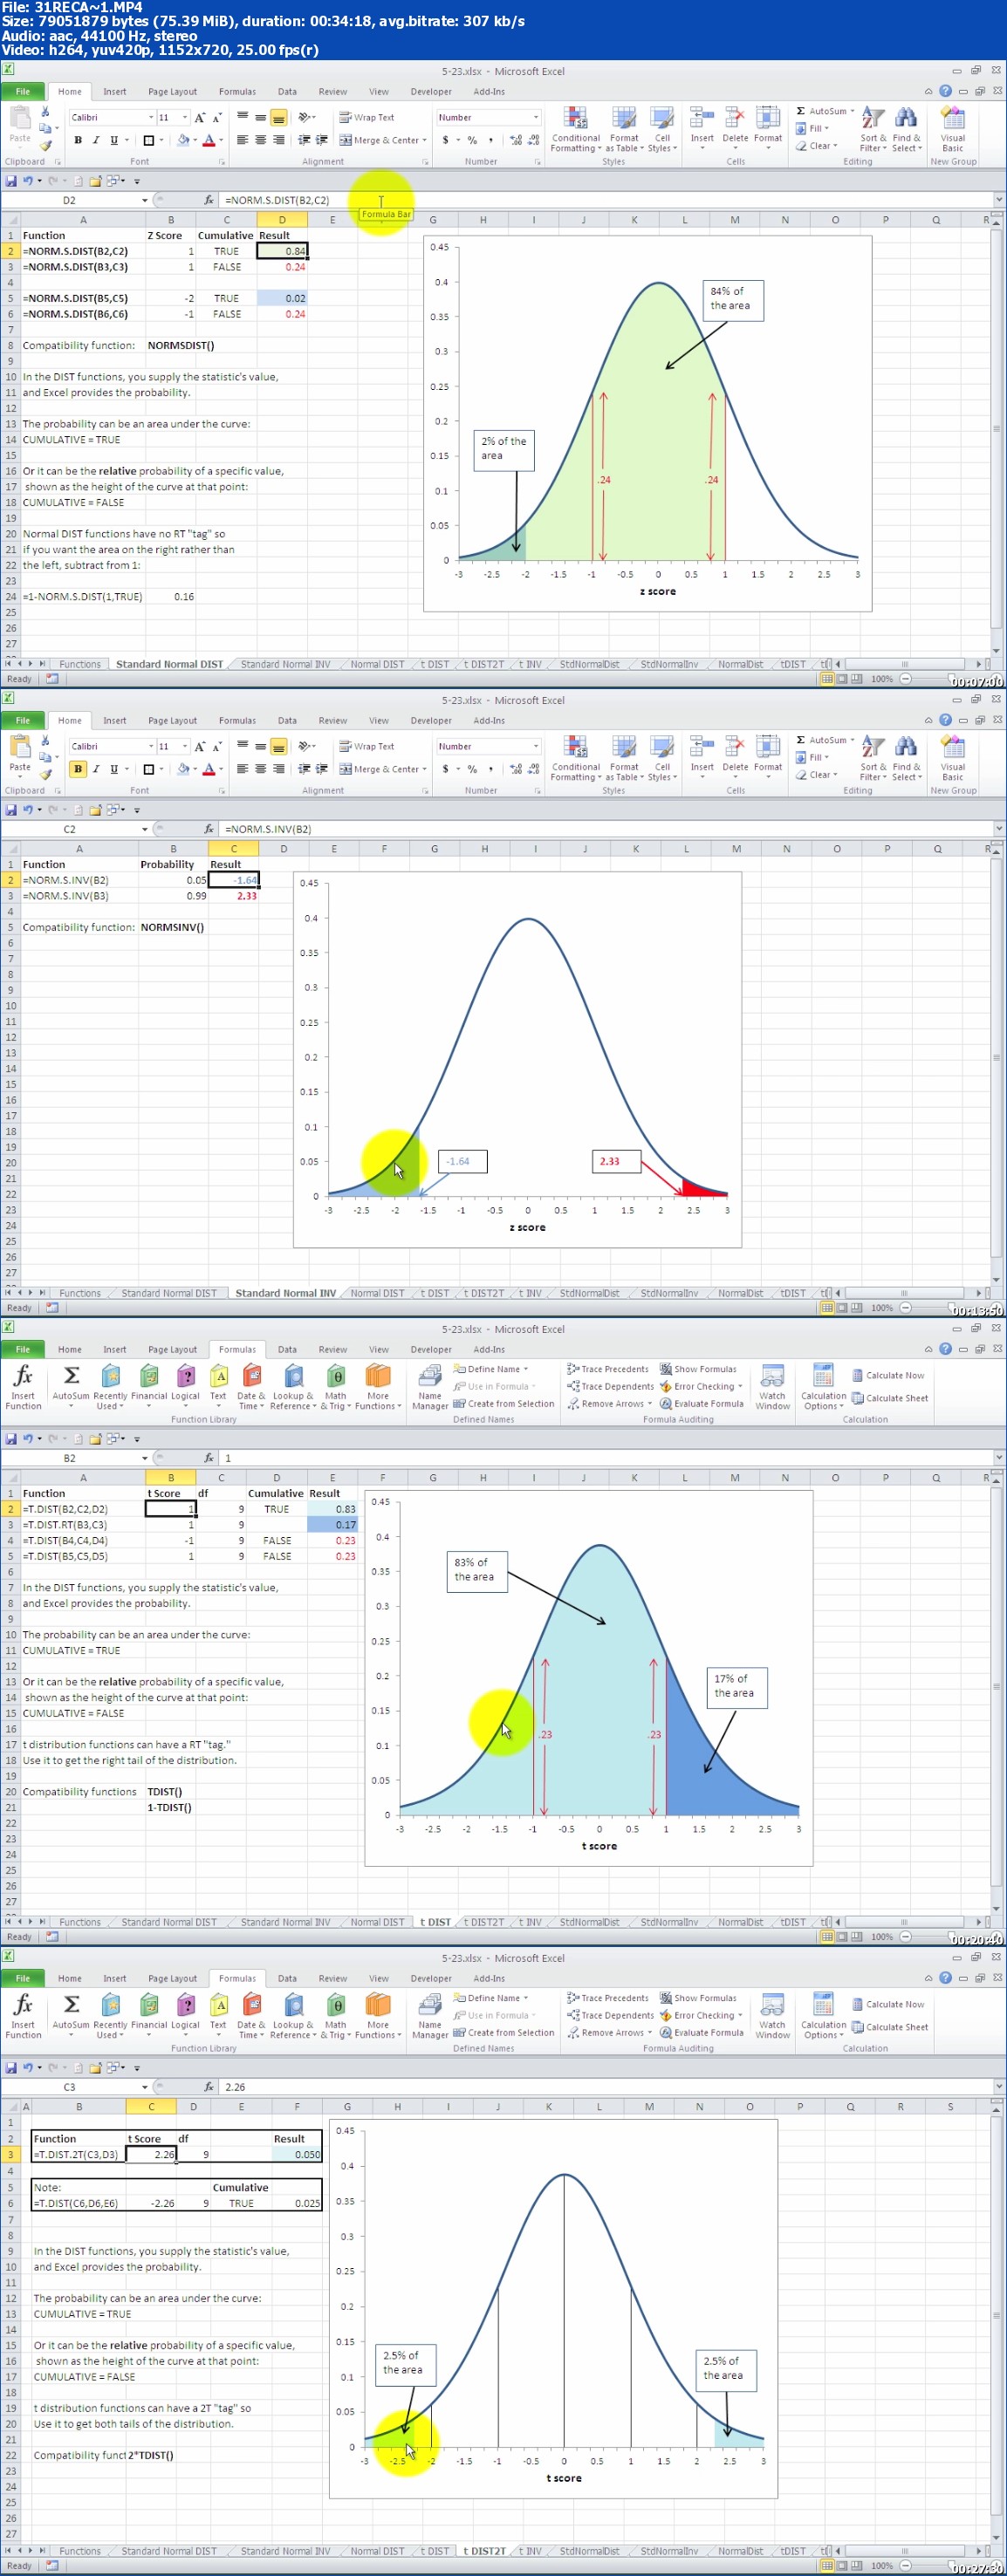
Language: English | .MP4 | AAC LC, 2 channels, 44.1 KHz | AVC High@L3.0, 1152x720 pixels, 25.000 fps @ 307 Kbps | Size: 916.38mB
Genre: E-learning
Language: English | .MP4 | AAC LC, 2 channels, 44.1 KHz | AVC High@L3.0, 1152x720 pixels, 25.000 fps @ 307 Kbps | Size: 916.38mB
Genre: E-learning
7+ Hours of Video Instruction
Statistical Analysis Using Excel LiveLessons is the world’s first complete video training course of its kind on the topic.
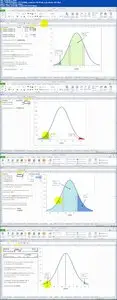
Bestselling author and trainer Conrad Carlberg provides the novice with 7+ hours of hands-on step-by-step video training on the fundamentals of statistical analysis. These videos make the concepts concrete using Excel charts, tools, and functions. Statistical analysis takes two main forms: descriptive statistics and inferential statistics. Descriptive statistics provide numbers that describe how values cluster together (averages), disperse (standard deviations), and vary together (correlations). Inferential statistics informs us regarding the probability that the descriptive statistics that we calculate from samples are accurate estimators of the populations from which we took the samples. These techniques are well worked out in theory and in applications such as Microsoft Excel. They have applicability in fields as diverse as politics and sports, as economics and agriculture, as psychology and business management, as achievement testing and manufacturing. This training on statistical analysis is designed to provide conceptual overviews of topics such as testing the reliability of the difference between the means of a treatment group and a control group, followed by demonstrations of how to handle the topic in Excel. Topics such as statistical power are crucial to understanding inferential analysis but history shows that they are very difficult to communicate through text. By using auditory explanations in combination with Excel's powerful charting capabilities, it's possible to communicate these abstract notions in a concrete fashion.
More Info
Screenshot:
(click to enlarge)
(click to enlarge)
LiveLessons - Statistical Analysis Using Excel, Volume I
NO Mirror links below
If Links broken please comment or sent a message to me, I will try to re-upload
Password Unrar: Avaxhome.28534