

Linear Regression Analysis Basics in SPSS Statistics
Linear Regression Analysis Basics in SPSS Statistics
WEBRip | MP4/AVC, ~393 kb/s | 1280 x 720| English: AAC, 48.0 kb/s (2 ch), 44.1 KHz | 411 MB
Genre: Business / Data & Analytics | Language: English | +Project Files
WEBRip | MP4/AVC, ~393 kb/s | 1280 x 720| English: AAC, 48.0 kb/s (2 ch), 44.1 KHz | 411 MB
Genre: Business / Data & Analytics | Language: English | +Project Files
Beginner and Intermediate Data Analytic Methods for Testing Main Effects & Interactions with SPSS and the PROCESS Macro
Linear regression is one of the essential tools in statistical analysis. In this course, we'll walk through step-by-step how to conduct many important analyses using SPSS.
Although you will learn the basics of what these statistics are, we'll avoid complicated mathematical discussions and go right to what you need to know to conduct these analyses.
Linear regression is basically a tool that allows you to test relationships between many variables at the same time, control for variables' effects, and create simple statistical models that allow you to make predictions.
In this course, we'll cover the following key topics:
- Correlations: You probably already know this, but understanding how to test the correlationbetween two variables gets us started in this course.
- Simple Linear Regression:Taking correlations one step further by creating a statistical model.
- Multiple Linear Regression:Being able to test multiple predictors at the same time and testing the unique effect of each.
- Hierarchical Linear Regression:How to test for the influence of different variables by adding them to the model one at a time.
- Interaction Analysis:How to test whether there's a two-way interaction between variables (also known as a "moderator" analysis)
You'll not only learn how to conduct these analyses, we'll also go over how to interpret the statistical results and how to graph the results using SPSS and a special Excel template I've created for you.
As a bonus, we also learn how to use a new free add-on to SPSS called "PROCESS," which simplifies a lot of the steps in doing interaction analysis in regression.
This course is meant to get you started in analyzing data using linear regression in SPSS. Whether you have data of your own that need to understand or you just want to know more about statistical data analysis, you'll get a running head start with this simple, easy-to-follow course.
I do linear regression analysis all the time in SPSS to conduct research in psychology, so I've become familiar with the steps it takes to pull off these analyses. I'm confident you will be able to, too!
What are the requirements?
- You will need SPSS installed on your computer
- You will need the PROCESS add-on, but we will walk through how to download and install this (free) add-on in this course
- You will need Microsoft Excel to use the graphing template, although this is not essential
- A rudimentary understanding of statistics (e.g., means, standard deviation, p-values) is recommended
What am I going to get from this course?
- Over 25 lectures and 1.5 hours of content!
- Analyze data using linear regression analysis
- Use SPSS and PROCESS to test interactions between variables
- Graph the results of data analyses to visually communicate the results
- Take a sample of data and create a simple equation to predict outcomes for people who you don't have data from
- Understand what regression is and how to interpret the output of statistical analyses
What is the target audience?
- Linear regression is a fundamental data analytic strategy, so if you have any data that you want to understand, this will be key
- If you have access to survey data (e.g., customer satisfaction, opinion polls, educational tests), you will learn how to think about those data with linear models
- Students taking a statistics course will benefit from a supplemental course like this one
Curriculum
Section 1: Introduction
Lecture 1 Introduction 03:17
In this quick introductory video, I'll give you a quick preview of what's to come in the rest of this course.
Lecture 2 Downloading the SPSS Data File Text
Before we move forward, you'll find the sample data file in this lesson.
Lecture 3 The Data File 04:03
In this video, we'll walk through the example data file that we'll be using in this course. You can download this file in the supplementary resources in the next lecture.
Section 2: Correlations
Lecture 4 Introduction to Correlation 04:07
We introduce the concept of the correlation coefficient as a simple way of considering the relationships between two variables.
Lecture 5 Running a Correlation Analysis in SPSS 02:23
Let's quickly walk step-by-step through the process of running a correlation analysis in SPSS.
Section 3: Simple Linear Regression
Lecture 6 Introduction to Regression Analysis 06:58
In this video, I'll expand on what a regression analysis is and why it offers more than a simple correlation. We'll cover what the regression equation is and how you could use it to make predictions from a sample dataset.
Lecture 7 Running a Simple Regression in SPSS 04:10
Let's quickly walk step-by-step through the process of running a simple regression analysis in SPSS.
Lecture 8 Graphing a Simple Regression in SPSS 02:33
In order to visualize the results of your regression analysis, you might be interested in graphing your results. This lesson will walk you through one simple way to do that in SPSS.
Section 4: Multiple Regression Analysis
Lecture 9 Introduction to Multiple Regression Analysis 06:53
Usually, we turn to regression analysis because we want to deal with multiple predictors at the same time. This is the kind of analysis you'd run to control for other variables.
Lecture 10 Running a Multiple Regression in SPSS 03:21
Let's quickly walk step-by-step through the process of running a multiple regression analysis in SPSS.
Lecture 11 Assessing the Success of a Regression Model 05:45
I thought this would be a good place to stop for a moment and discuss the idea that regression analysis is all about creating a statistical model for your data. With that comes the need to assess the quality of your model, and we'll go through a few key indices of model fit.
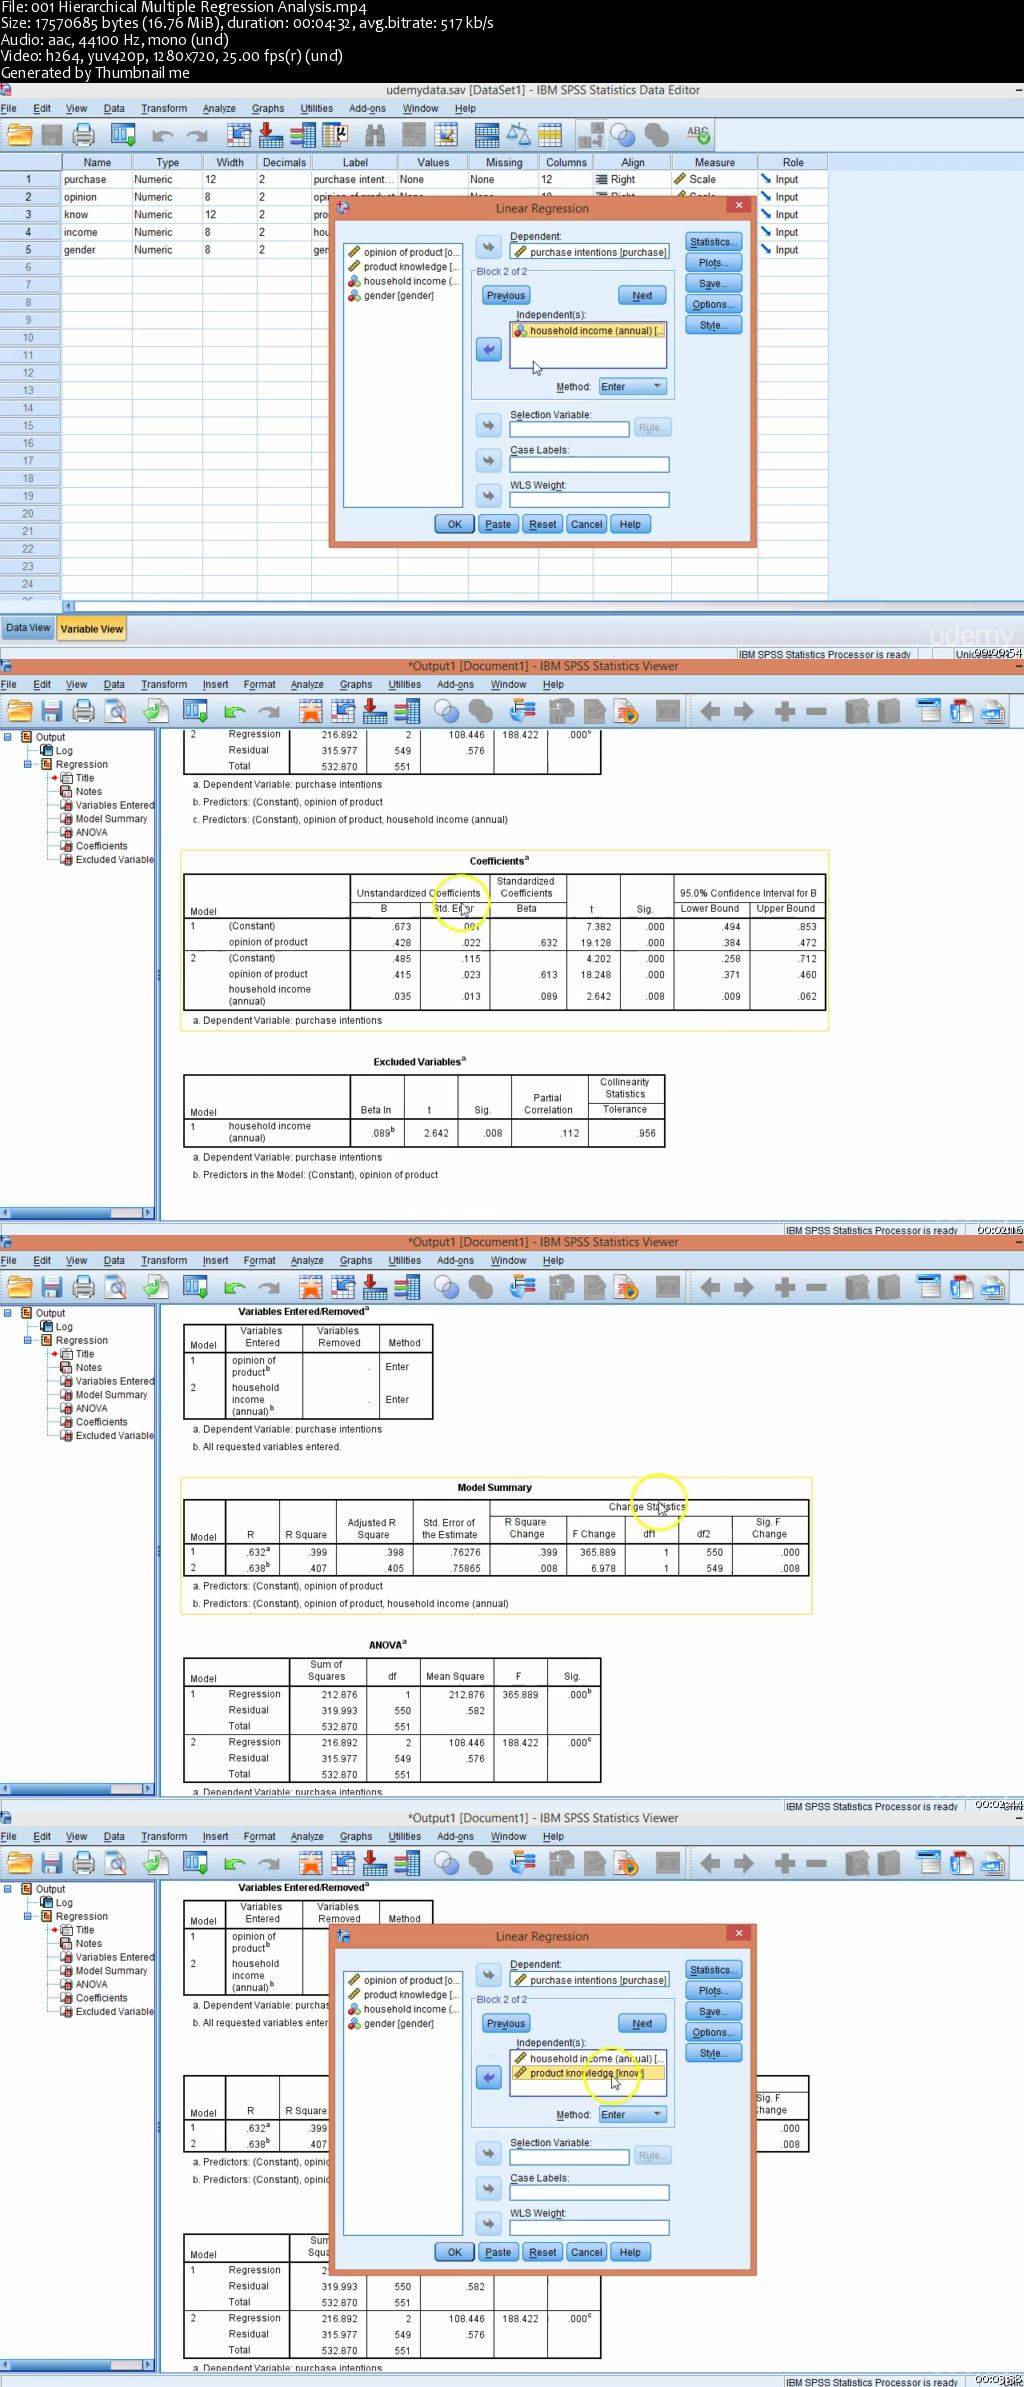
Section 5: Hierarchical Multiple Regression Analysis
Lecture 12 Hierarchical Multiple Regression Analysis 04:32
Hierarchical regression models are essentially multiple regression models broken into several steps. This offers a few key advantages, which we'll look at in this video.
Lecture 13 Leaving a Review 01:35
Section 6: Interactions in Regression Models
Lecture 14 Introduction to Interactions 02:43
We'll now turn to cases when you want to look at the effect of one variable that depends on the effect of another. By using an interaction analysis, you can test these hypotheses.
Lecture 15 Running an Interaction Analysis in SPSS 03:47
Let's quickly walk step-by-step through the process of running an interaction analysis in SPSS.
Lecture 16 Downloading the Graphing Template Text
See this lesson for instructions on downloading the handy Excel graphing template.
Lecture 17 Graphing Interactions 07:57
See the supplementary resources for this lesson to download the Excel file I use in this video. It will help you easily graph an interaction.
Section 7: Interactions Made Simple with PROCESS
Lecture 18 Downloading PROCESS 01:33
To make things easier, you can use a special add-on for SPSS: "PROCESS." This is a free add-on, and in this video, you'll see where you can download the materials.
Lecture 19 Installing PROCESS 03:16
Once you've downloaded and unzipped the PROCESS files from the previous lesson, you'll need to install it in SPSS. This video shows you how.
Lecture 20 Using PROCESS to Conduct a 2-Way Interaction Analysis 03:37
Now that PROCESS is installed in SPSS, let's use it to do an interaction analysis between two continuous variables.
Lecture 21 Interpreting the Output from PROCESS 07:16
Time to make sense of the SPSS output! In this lesson, I'll walk you through what all of the output means.
Lecture 22 Graphing Interactions from PROCESS Output 05:19
You can use the same Excel file from a previous lesson to graph the interaction that PROCESS supplies you with.
Section 8: Interactions with Categorical Variables
Lecture 23 Running an Interaction with a Categorical Variable in SPSS 04:37
Until this point, we've only considered the role of continuous variables in our regression analyses. You may want to include categorical variables in your model, though. In this lesson, I'll show you how to analyze an interaction between a continuous and a categorical variable using PROCESS in SPSS.
Lecture 24 Graphing an Interaction with a Categorical Variable 03:48
Once you have the output from your interaction analysis, graphing it isn't much different from the other times we've graphed an interaction.
Section 9: Conclusion
Lecture 25 Conclusion and Farewell 01:07
Linear Regression Analysis Basics in SPSS Statistics
LabView - Collective Books
Mega E-books Pack (2013)
Malware Centric E-book Collection
Huge Electricity, Magnetism, A..., Healing - EBooks Collection
Premium IT eBooks Collection
Huge Encyclopedias - EBooks Collection
Osprey Publishing - Military History Books Collection
Gale Encyclopedias - Full Pack
IT Books Collection (Basic - Intermediate - Advance)
Medicinal and Aromatic Plants - 50 Volume Set
Doctor Who ebooks Collection
Learning HTML Ultimate Collection
Comprehensive Robotics Books Collection
Great Royal Web Design Pack
Civil Engineering Geotechnical books
Luftwaffe Colours Collection
Many Thanks to Original uploader.
For More Rare Movies Check out my blog!
Download Links:
No Mirrors Please